How To Create Amazon Infographics


Table of Contents
- What Are Amazon Infographics?
- How To Make An Amazon Infographic
- Designing Your Amazon Infographics
- How to Add Your Infographic On Amazon
- Final Words
- Frequently Asked Questions
Listing images are powerful tools in attracting potential customers, but it is the art of infographics that will ultimately help you secure buyer purchases. 65% of people are visually inclined learners, and most notably in this bustling life, they will not have the time nor patience to read the information in great textual detail. The web previously proved a dreary place to digest information, which is why the arrival of infographics has made such a turn out ever since 2012.
Infographics use a visual representation of data with skillfully condensed information in a neat package.
This encourages Amazon shoppers to absorb information fast and make a quick but well-informed decision. In short, information now is visual, condensed, and most of all – easier to grasp. You can take a variety of infographic angles in your Amazon listing Images; Feature, Zoom-In, Dimensions, Package Includes, and Icon Infographics.
But like any beautiful creation, infographics require knowledge and a certain flair of art to attract your audience masterfully. Today, we will explore a guide on how to create compelling infographics.
What Are Amazon Infographics?
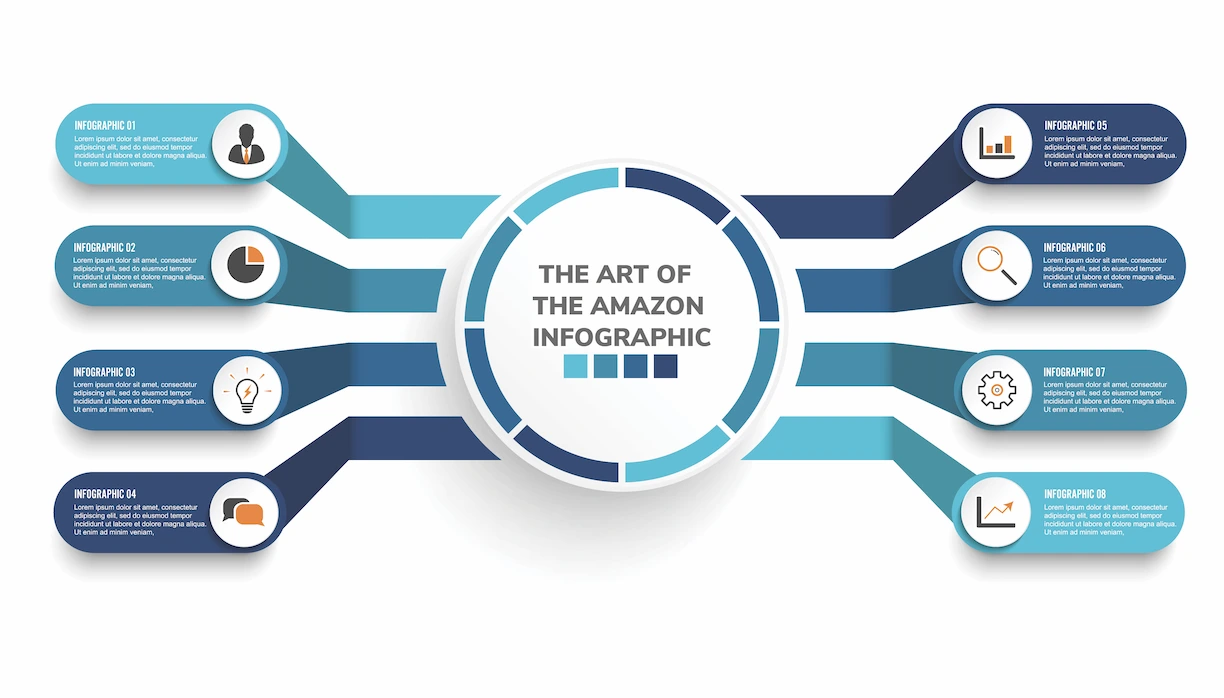
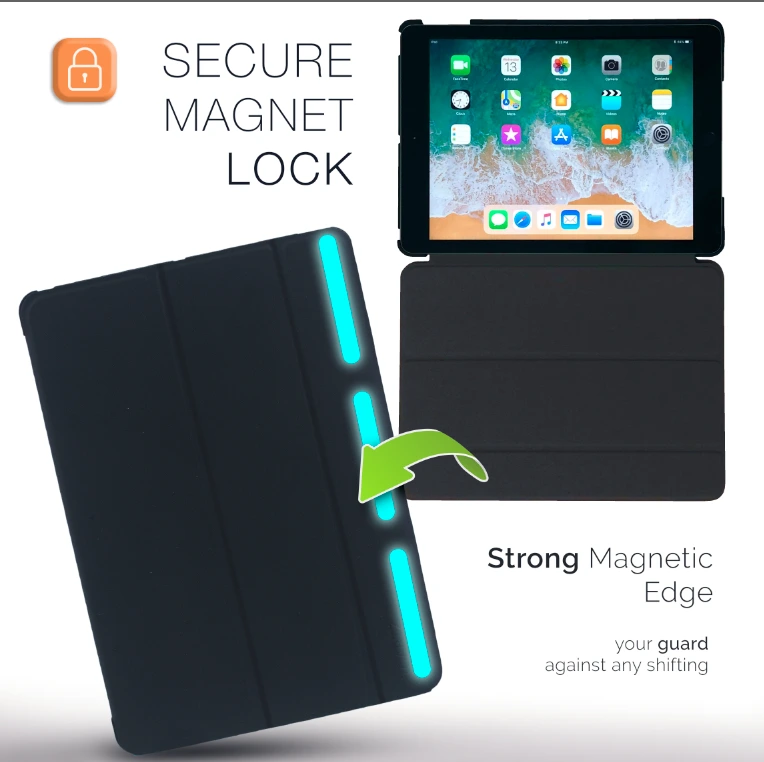
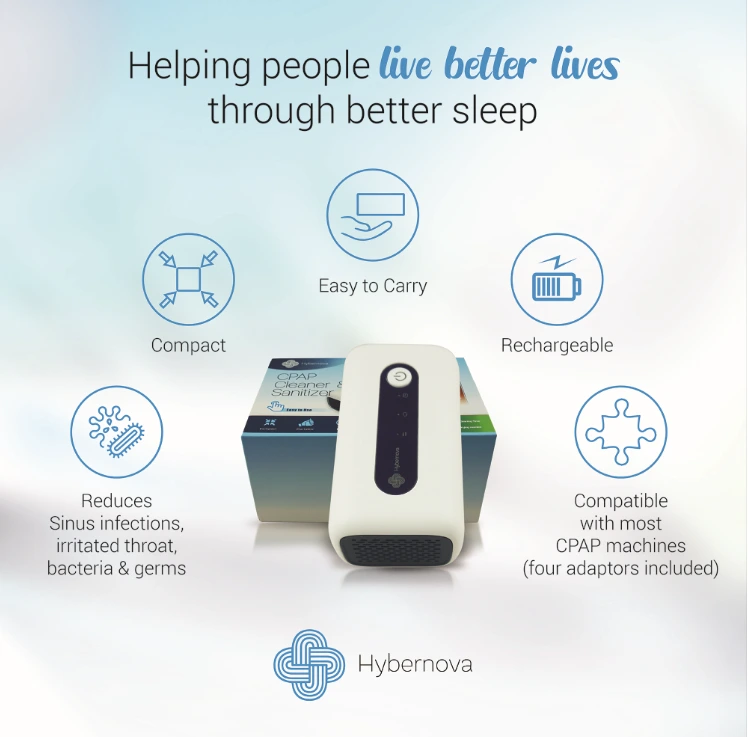
An Amazon infographic is an image that conveys both a visual representation of a product and written feature information. Amazon infographics are a great way to include multiple marketing features or important contextual product information (such as item dimensions) in a single Amazon listing image.
How To Make An Amazon Infographic
Start with a plan!
Every image has a story to tell. Consider what kind of story you are trying to portray and what summarizes your product best. Your listing images should be sequenced in the order of questions customers will have when selecting a product.
To create such a roadmap for your images, you must first find answers to some basic questions such as:

1) Who is your target audience? Knowing who you are targeting is crucial for deciding what information to include. For example, if you are selling fitness bands, then your target audience would be active people between the ages of 18 and 35 years. These individuals are most probably busy in their work or student life and hence should be informed that these bands can be used indoors, outdoors, at home, and at the gym, so they do not necessarily have to run to the gym after their work or classes and can work out from anywhere.
2) What are you trying to achieve, ultimately? Making infographics because they are trending is not adequate. You need to find out how it can help you establish your audience, gain buyer confidence, and increase your conversions.
3) How do you give your audience a brick & mortar experience? Putting yourself in the buyer’s shoes is the best way to do this. Imagine if you were to see your product for the first time online, what would be the questions that would come to mind? Put together all answers to those questions and include them in your infographics. This could be dimensions, material details, installation method, etc.
Designing Your Amazon Infographics
The Content – Choose a captivating feature heading to bring out the very essence of your infographic. A key feature that caters to the customer’s emotions and desires is a definite way to gain their interest. Since there is limited space available – Keep it simple, bold, and informative. You can use the format below to create a compelling infographic image:
- What is the feature?
- What product attribute allows for that feature?
- What problem does it solve?

Experimenting With Typography – Begin by identifying the relevant font for your product category and your brand message. For example, Script fonts are based on handwriting and will give your image a luxurious or elegant touch, so they are most suited for jewelry or makeup categories. Sans Serif fonts emphasize readability and simplicity, so they are useful for adding a modernized touch to your images and could be best suited for any minimalist-designed products like a wooden tray.
Here is a table with a list of different fonts to help you make a selection:
| Serif Fonts | Sans Serif Fonts | Script Fonts | Decorative Fonts |
The Perfect Color Palette – Create a mood board and include all the colors that will compliment your brand and your product specifically. These colors can be taken from the brand logo, the product packaging, product colors, neutral tones, or even from the brand message. For example, if your brand promotes eco-friendliness, you can use earthy tones like green, beige, and white as your color palette. This color palette should guide your theme for the font, props, icons, picture background, and anything else that may be a part of your infographic images. Too many differentiating colors can take away from your infographic’s aesthetic. At most, use a different shade of the color included in your palette. Take a step back and observe every element to make sure it looks elegant.
Tip: Use apps like Pinterest to create a mood board of images, colors, and fonts that you like. There are tons of websites with mood board templates. Applications such as Canva can help create a branding kit for your brand.
Choosing Attractive Icons – Your selection of icons should not only visually pop but also be visibly clear with the intended meaning. To add an extra layer of clarity to your icons, design them yourself using Adobe Illustrator or a similar software and add some text.
An example would be a rabbit displayed in an icon. Now, many people may have seen this icon and would instantly know what it signifies but for those people who may not know, it would be helpful if the text “cruelty free” is displayed underneath or inside the icon. Icons are not only easy to read and understand but also invoke trust within the audience.

Relevant Background/ Photographs – A relevant setting or prop in the background image can help you highlight the features better or make the benefits more prominent. Similarly, using a high-quality product picture is significant in making your infographics more appealing and displaying the correct information. Zoom in, show what the package includes, display features, dimensions, and showcase icons to add
Creating Symmetry – The most important of all – Balance! Avoid cluttering too many elements on one side or, in contrast, leaving a lot of empty space on one side. A good rule of thumb is to keep at least 20 pixels distance between your elements as well as between your elements and the edge of your canvas. An extra step you can take to ensure balance is by using a 3×3 grid on top of your image and seeing to it that none of the boxes are visually noisy.
How to Add Your Infographic On Amazon
For existing Amazon products, go to your “Manage Inventory” page to edit a specific listing. Then navigate to the “Images” tab to upload your Amazon infographic. Keep in mind, that new listing images may take up to 24 hours to appear on your product page.
Final Words
If you would like to learn more about Amazon Listing Images, check out our previous blog. Be sure to check out Helium 10, and the suite of tools that are available to you such as their Amazon product research tools.
Frequently Asked Questions
Achieve More Results in Less Time
Accelerate the Growth of Your Business, Brand or Agency
Maximize your results and drive success faster with Helium 10’s full suite of Amazon and Walmart solutions.

