
Helium 10 vs. Jungle Scout Accuracy: Amazon Search Volume


Table of Contents
- Which one has 93.5% Accuracy for Amazon Search Volume Data?
- Introduction
- The Importance of Search Volume for Amazon Sellers
- How Search Volume Estimates Are Generated
- Understanding Normalized vs. Denormalized Searches
- Comparing Helium 10 and Jungle Scout: A Case Study
- Methodology and Data Collection
- Jungle Scout vs. Search Query Performance
- Helium 10 vs. Brand Analytics
- Further Analysis of Jungle Scout's Data
- Interpreting the Results
- Conclusion
Which one has 93.5% Accuracy for Amazon Search Volume Data?
Introduction
Who has the most accurate Amazon Search Volume? Helium 10 or Jungle Scout? I recently did a mini case study to show how Helium 10 had 93.5% order accuracy of search volume, while Jungle Scout had an accuracy rate of 41.9%.
Make sure to read to the end to see all of the verifiable data that shows the search volume showdown results! But before I get into how I was able to calculate the accuracy, it’s important to understand why search volume is one of the most important metrics that Amazon sellers need.
It’s been a while since I have done an OpEd like this. Buckle up, you’re in for a wild ride!

Outclass Your Competitors
Achieve More Results in Less Time
Maximize your results and drive success faster with Helium 10’s full suite of Amazon and Walmart solutions.
Sign Up for FreeThe Importance of Search Volume for Amazon Sellers
Search Volume is primarily used for 3 main reasons:
- Prioritization of keywords in Listing Optimization
- Prioritization of keywords in Amazon Advertising
- Gauging listing strength in a niche
Here are some examples of the above. Let’s say you use an advanced Amazon keyword research tool like Cerebro, in order to find all the relevant keywords to your product that you want to put in your listing.
The number of keywords that you find could be in the thousands. Let’s say that maybe there are 200 keywords that are the most relevant to your listing. You know that you have to put the most important keywords in phrase form in a listing to send relevancy signals to Amazon. However, there is NO WAY you can put 200 different keyword phrases in a listing…there is not enough room.
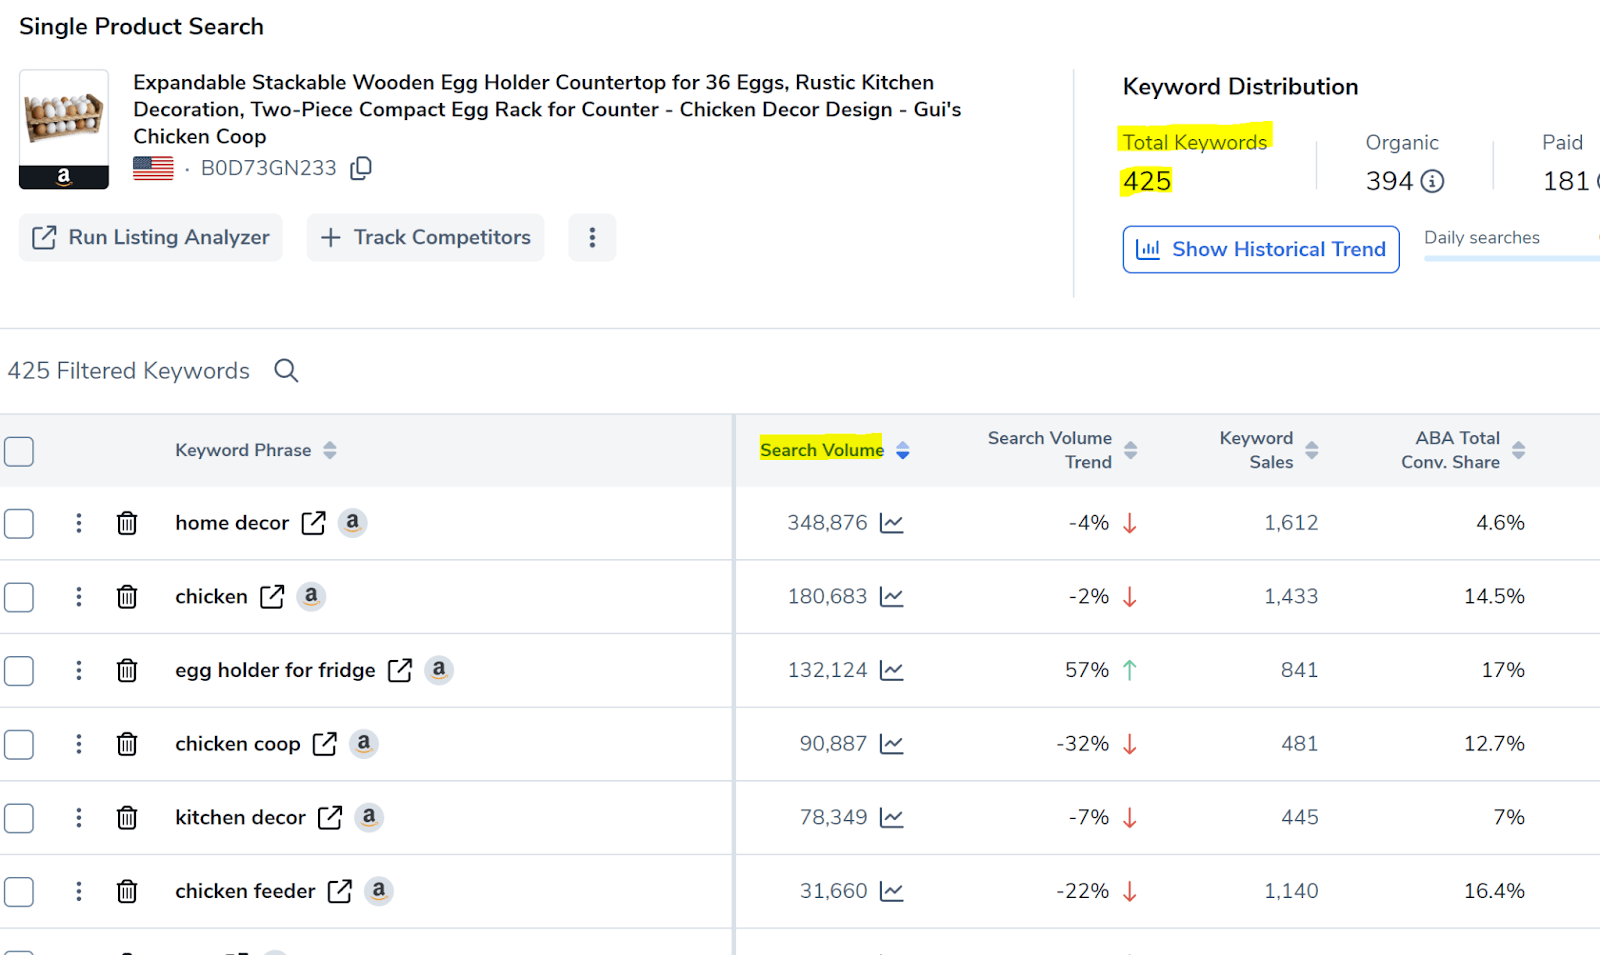
Usually, you might be able to only focus on 20-40 keywords to optimize in a listing in phrase form. If there are 200 keywords all equally relevant, how do you choose which are the 20-40 you put in your listing? You use search volume to prioritize.
If one keyword has 10,000 monthly searches, and another one has 1,000, which one has the potential to bring more sales to you? Obviously, the one searched more, if they were equally relevant. This is why knowing the search volume of keywords is so important.
Another reason would be for Amazon advertising. Are you going to start from day one targeting 200 keywords? Maybe if you were independently wealthy and had deep pockets for PPC. But most likely you might want to start with the most searched keywords.
Or what if in the opposite scenario, you are limited by your budget, and didn’t want to go after the highly searched keywords in the beginning and maybe wanted to go after some mid-tier keywords instead? Once again, search volume is what can help you choose which keyword to target.
Here’s another scenario: You are running the Xray Chrome Extension on your competitors and notice they are making more sales than you. You then go back to use Cerebro to compare all the keywords to see what are the keywords giving them the most traffic compared to you. Looking at search volume with the keyword ranks can give you a picture of the traffic difference between you and your competitor.
As you can see, search volume is critical to the processes of Amazon sellers. Arguably the only other metric that can help a seller even more is the estimated sales that each keyword drives, which Cerebro shows. This goes beyond just the number of searches but tells you the number of purchases that search for the keyword drive.
Some keywords have different buyer intent, and thus at times you will find two keywords with similar search volume, but one gets way more sales than the other.

Since Jungle Scout does not have the keyword sales metric we cannot compare Helium 10 accuracy to it, so let’s just stick to what both platforms have: search volume.
How Search Volume Estimates Are Generated
How do tools like these even come up with search volume estimates? Starting in 2018, Amazon made its internal search volume metric available for tools like Helium 10 use, and so Helium 10 immediately started ingesting that data. When Amazon turned off that data point, Helium 10 had more than enough data points to continue making estimates based on their historical data, and advanced algorithms based on other data points that Amazon has provided.
An important thing to keep in mind is that as valuable as search volume is, it’s not necessarily the raw number of searches that is the key component. As mentioned above, the main reason we need search volume is for prioritization. You can do that without the actual number of the search volume.
A few years ago, Amazon released a very valuable tool called “Brand Analytics Top Search Terms.” It’s a tool that tells sellers what were the top 2-3 million searched keywords, and ranks them in order of descending search volume…..however, it does NOT show the actual search volume number.
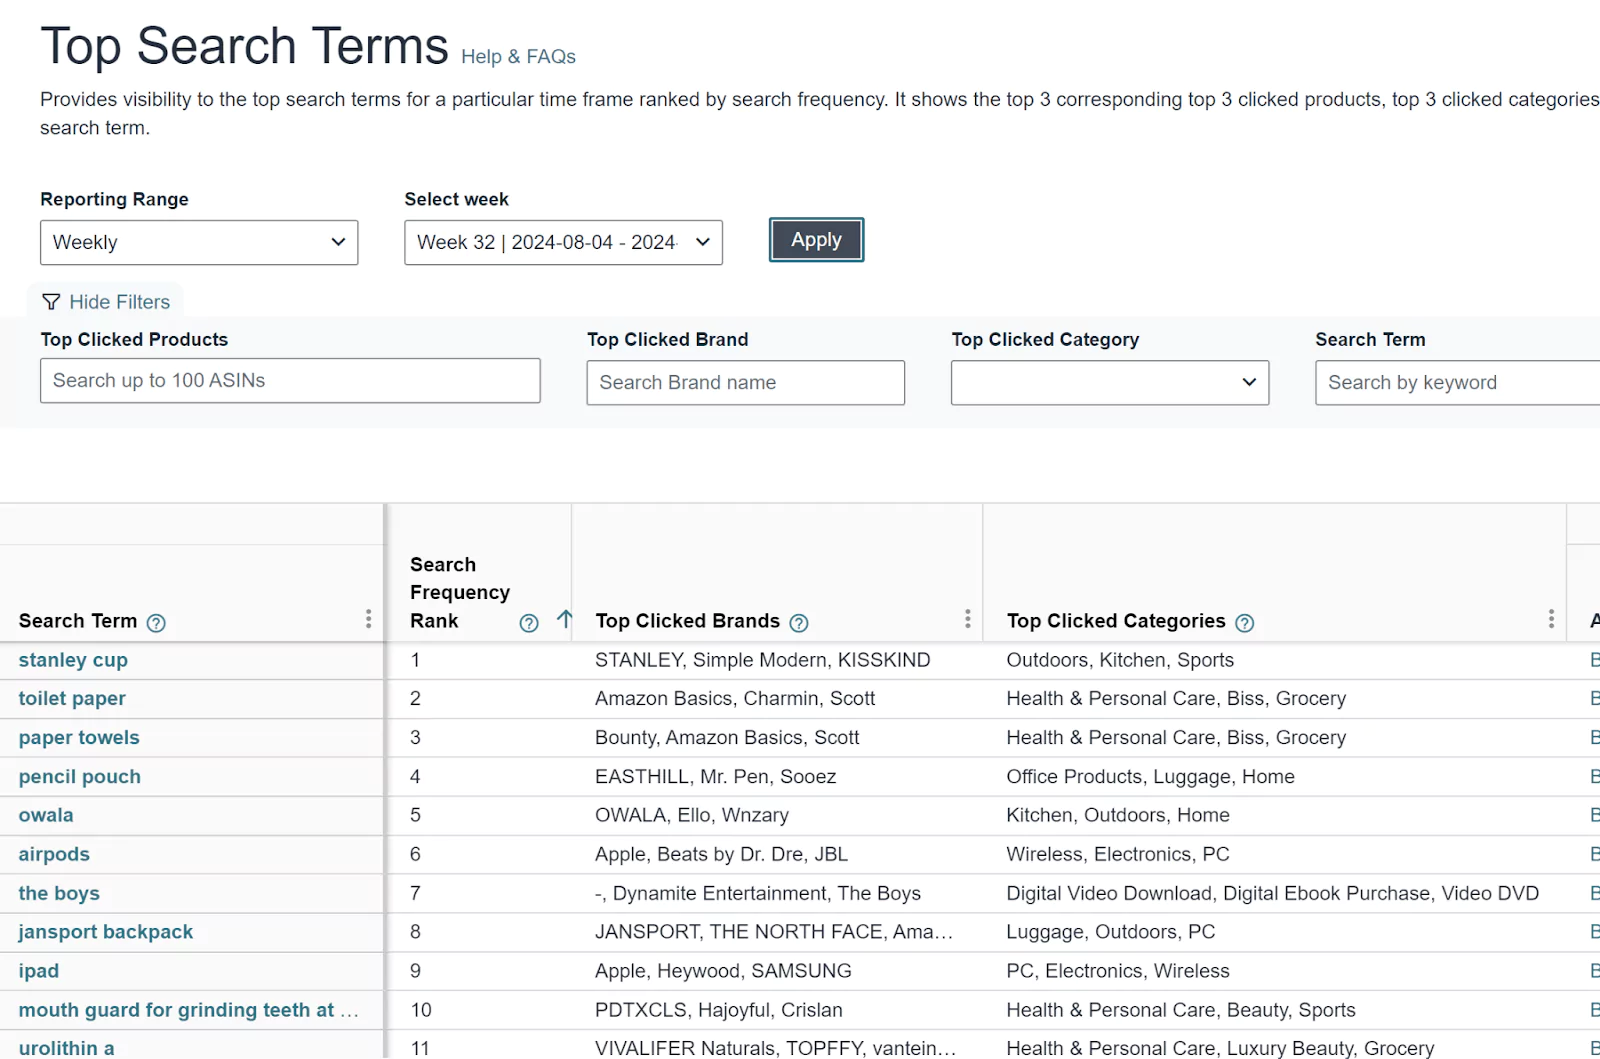
If you do not have Helium 10 to get search volume, you can use Brand Analytics to help prioritize keyword research, even though it doesn’t even display a number of the searches…it shows the arguably more important component of the “Search Frequency Rank.”
Brand analytics is based on “normalized searches.” This means that if a person searches a keyword at 8 AM, clicks on a top selling product, then clicks back his browser, then clicks to page 2 of the search results, then clicks on another product, clicks back again, then 5 hours later searches that same keyword, it only counts as ONE search. This is important to understand.
Amazon also has tools that utilize “denormalized” search volume. In the same scenario above, those tools would have counted that as FIVE searches! Two of the tools that utilize this data point are Amazon Product Opportunity Explorer and Search Query Performance. Both are GREAT tools that Amazon has graciously provided sellers!
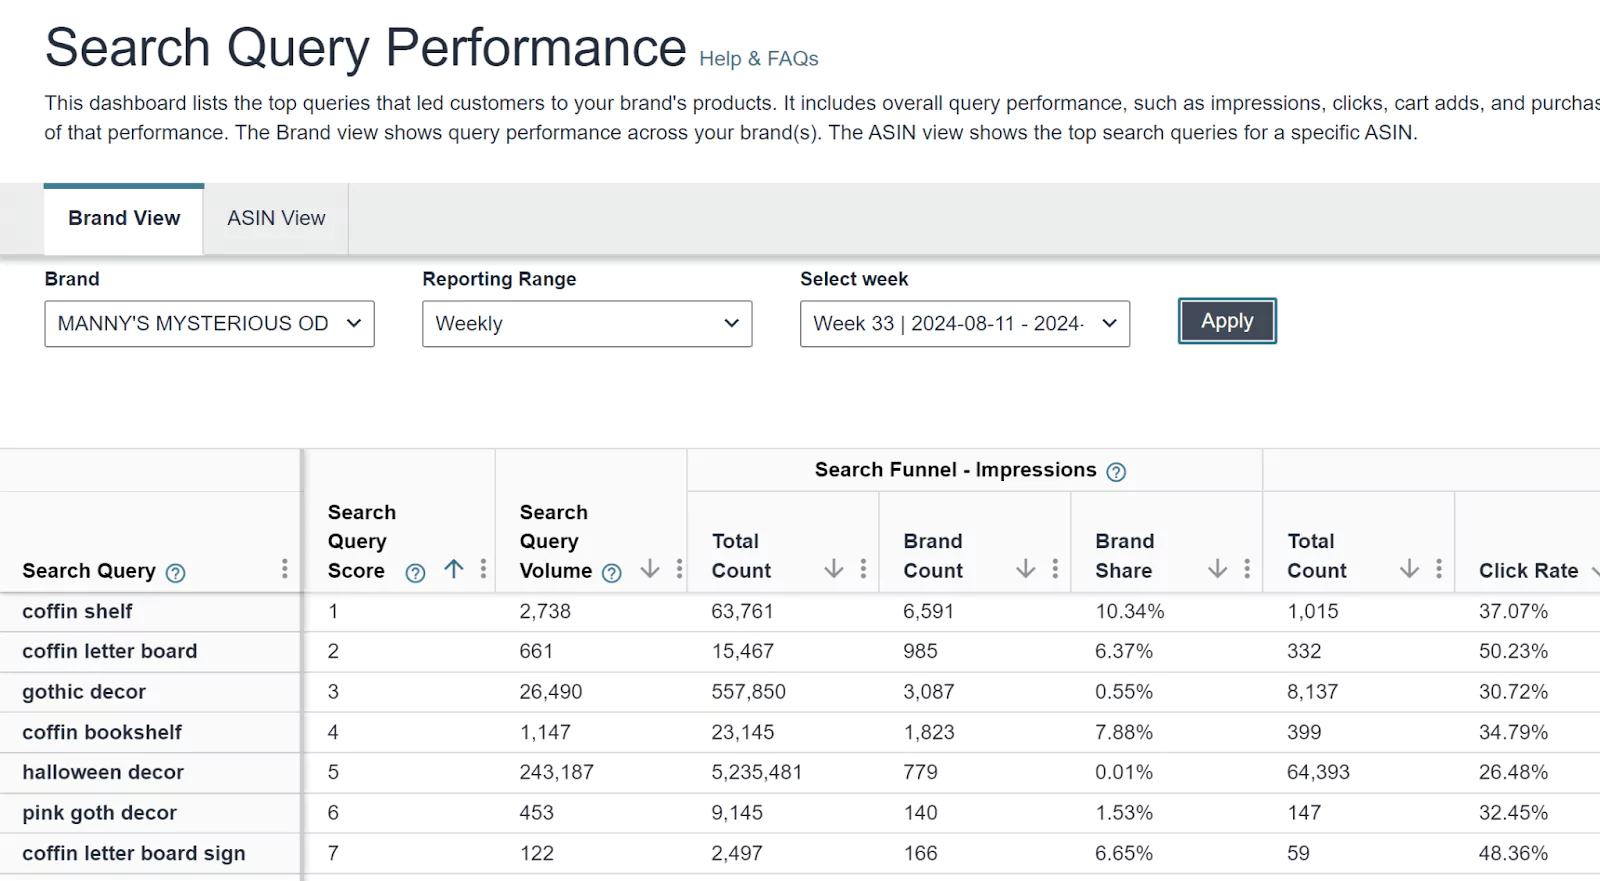
Understanding Normalized vs. Denormalized Searches
Helium 10’s search volume has always been based on normalized searches, like the original search volume that Amazon used to display. To us, this gives a better understanding of the Amazon traffic coming from search, as you can see why above!
Comparing Helium 10 and Jungle Scout: A Case Study
Recently, there has been a lot of misinformation spreading around Linkedin, and in blogs published by Jungle Scout, that has confused Amazon sellers as to the accuracy of Helium 10 vs. Jungle Scout for search volume.
For example, there have been a few “comparisons” being posted around where people are trying to do a direct comparison between Search Query Performance, Jungle Scout, and Helium 10.
The first thing to understand is that this should never be compared. Search Query Performance and Jungle Scout are basing their numbers on denormalized searches. Helium 10 is based on normalized searches. These are almost like two completely different metrics! It would be like someone wanting to compare the Amazon Advertising PPC Impressions metric with the Amazon overall “page views” metric. Two completely different metrics that refer to completely different things.
Here is an example of one of the posts floating around where someone is posting how different Helium 10 is from Jungle Scout and SQP.
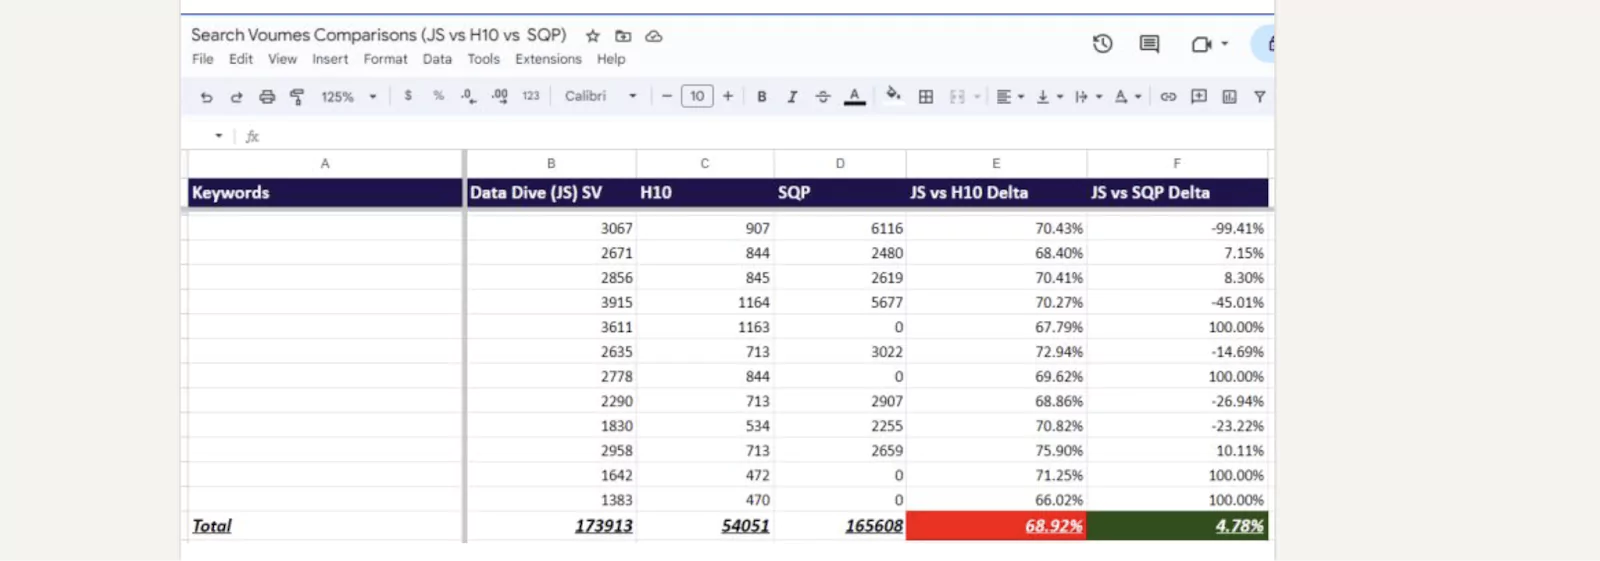
When someone first sent the above screenshot to me, I did not engage. There is always misinformation out there, I can’t go around correcting every single one. However, this post soon blew up as leading executives of companies in the space started reposting, commenting, and boosting up this post inferring that this was a sound study and that they “see similar results” in their “own validation.”
Due to this terrible misinformation floating out there, I decided to set the record straight and show the real numbers.
The first thing I noticed was that the person doing the comparison above was comparing the Helium 10 and Jungle Scout monthly search columns based on the week ending 8/10, with the full month search volume of Search Query Performance from July 1 to July 31. So even if he WAS comparing something that COULD be compared (which he was not), it was already based on wrong information.
Methodology and Data Collection
Thus, I went to Helium 10, Jungle Scout, Brand Analytics, and Search Query Performance and decided to tabulate all the numbers from 31 keywords that I had access to for one of the brands I sold.
The first thing I did was compare the Jungle Scout “30-Day Search Volume” with the total searches in the last 4 full weeks of Search Query Performance. SQP’s week ended the same day as the Jungle Scout Week, so it was a perfect comp.
Something to keep in mind…all of this data is completely open. Anyone can pull the data I’m going to show in Helium 10, Jungle Scout, Brand Analytics, and Search Query Performance. No need for me to fudge or make up any numbers since it can be easily verified.
Here is the first dataset:
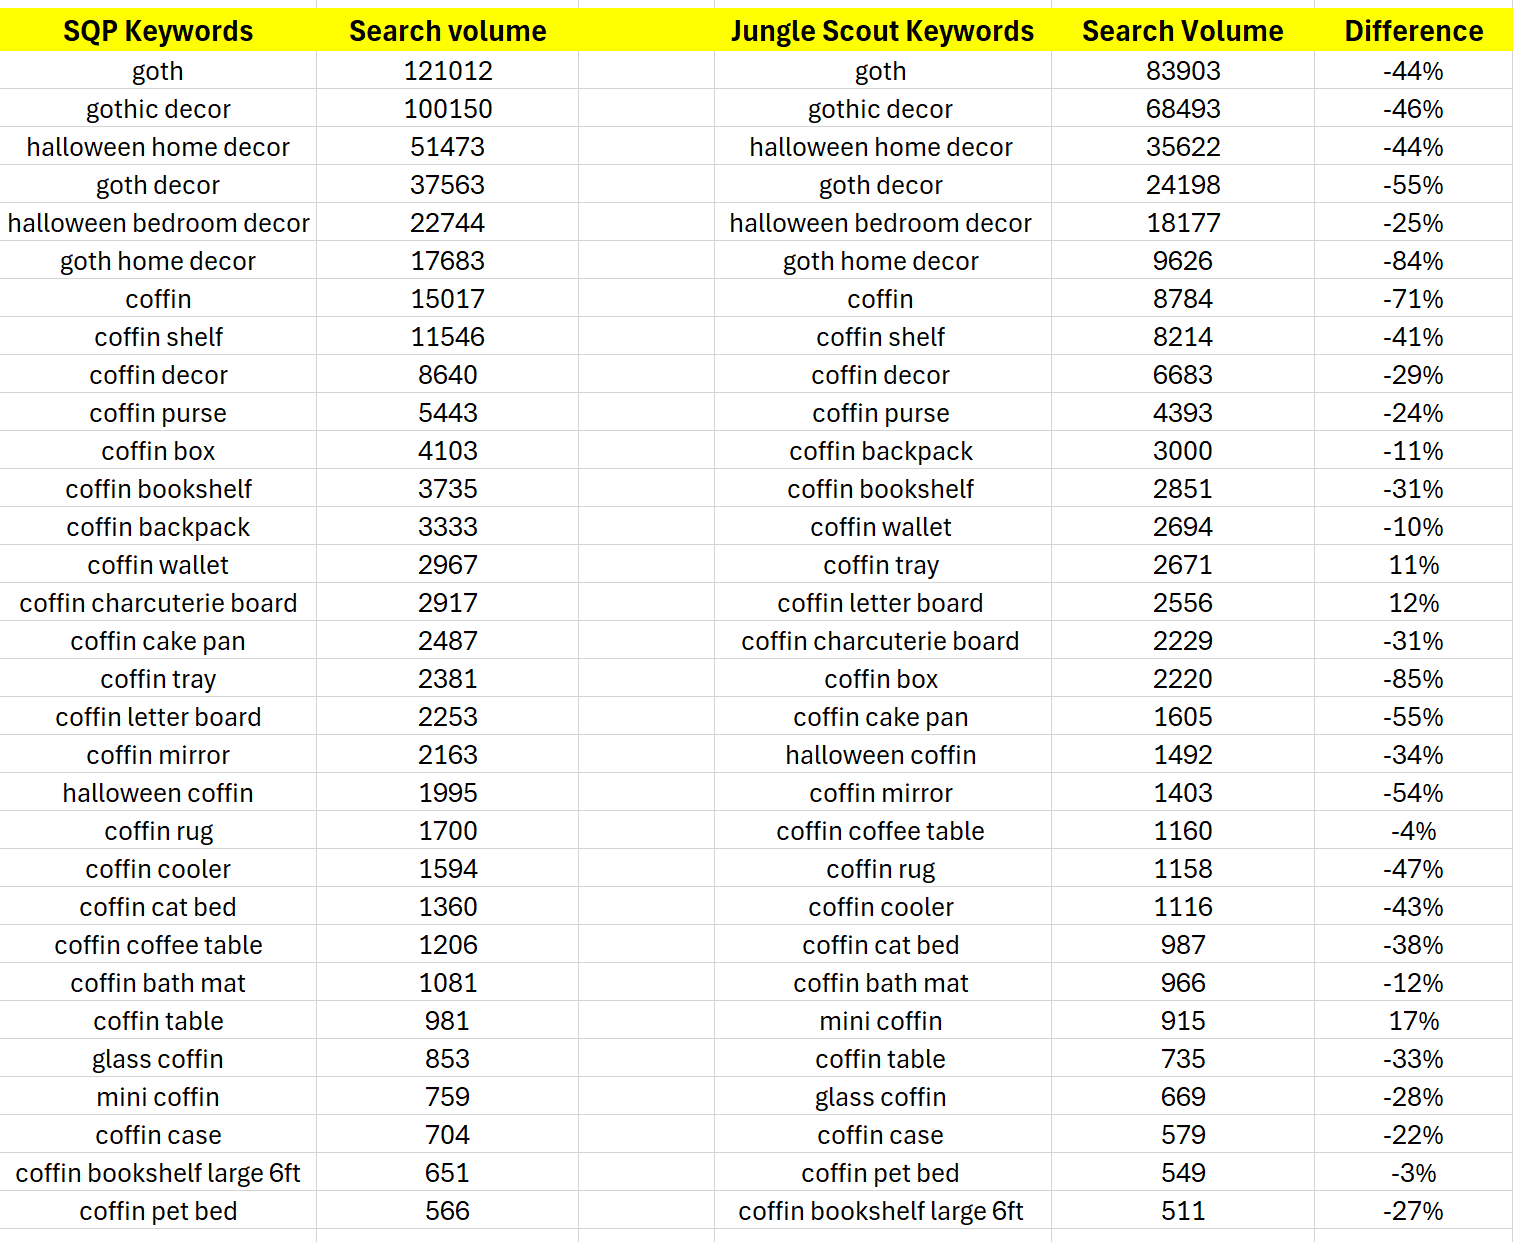
Jungle Scout vs. Search Query Performance
As you can see, with this “apples to apples” comparison of two search volumes that are based on denormalized searches, Jungle Scout is far off from SQP. On average it was 34.5% off. If you just take the average of the difference it under-reporting the search volume by 32%.
However, what did I say before? In my opinion, the number is not necessarily the most important thing. To prioritize keywords, you just need to know the relative ORDER of which are the most searched. So instead of judging Jungle Scout by the raw search volume number which it was far off, why not compare the relative order of the keywords based on the search volume number to Search Query Performance?
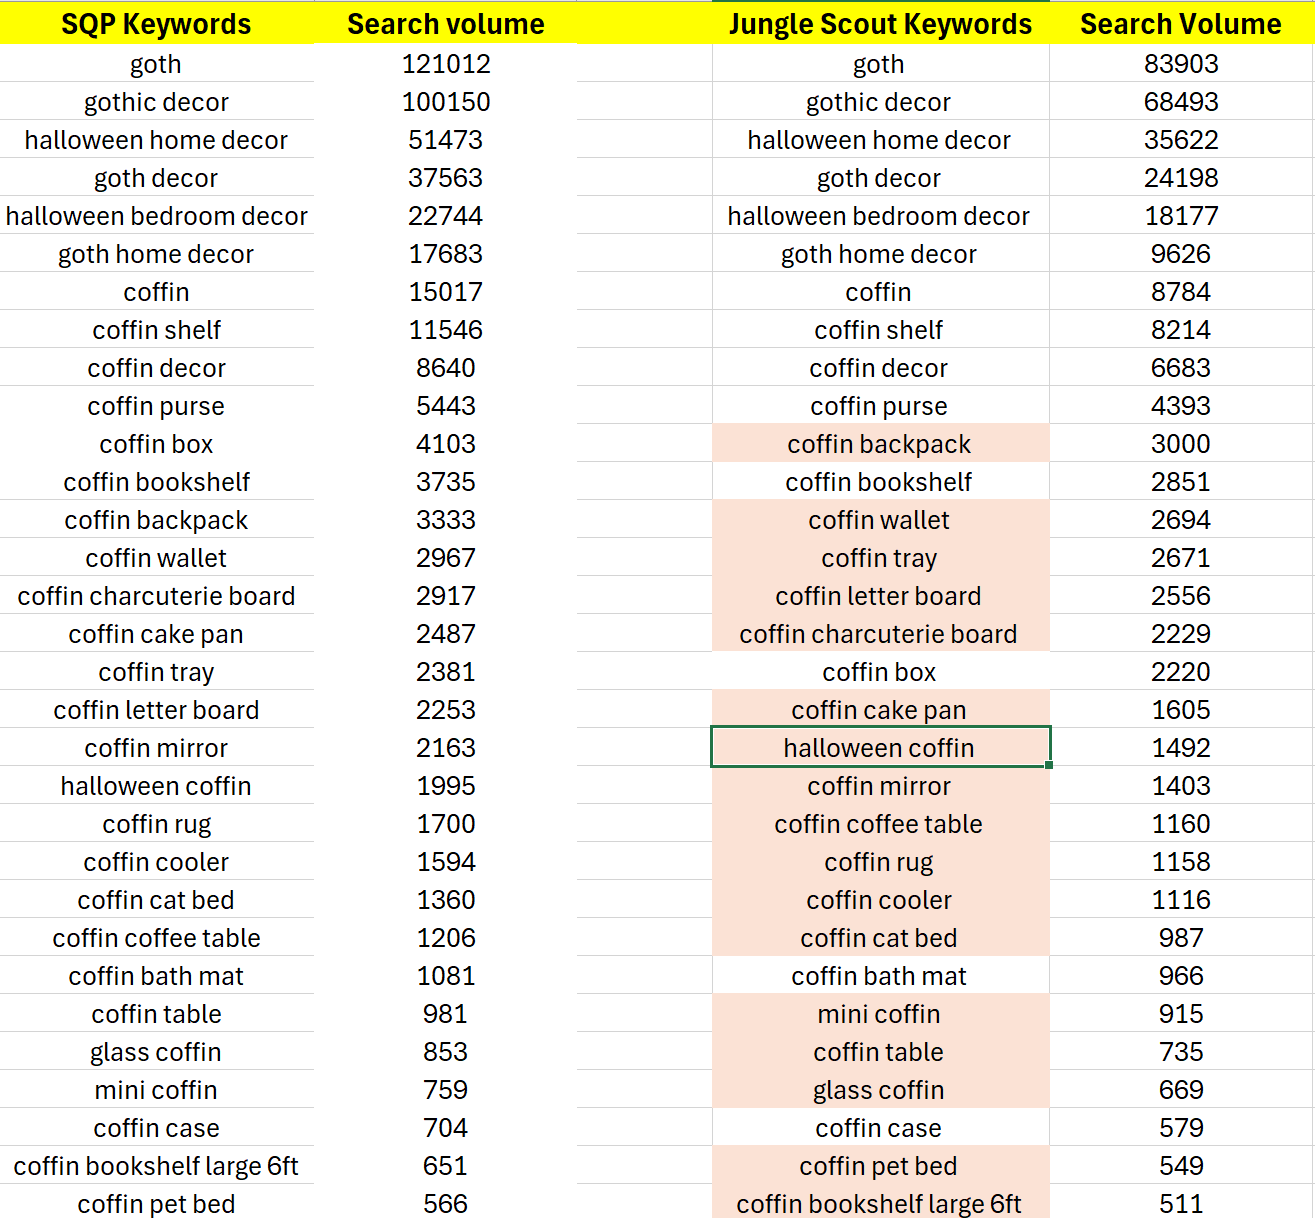
Jungle Scout started off great, getting the correct order of search volume almost 100% identical on the first 10 keywords. It got me worried when I was going through it since I was tabulating this data line by line, thanks to me not knowing how to do pivot tables, vlookups, and whatnot. I was thinking “Don’t tell me Jungle Scout is going to be 100% accurate with the order of the keywords!”
However as I went down the list, the order started deviating. The ones highlighted above were the ones that they did not get the order correct. In total, they got 13 out of the 31 in the correct order for an accuracy rating of only 41.9%!
But don’t get me wrong. I’m not trying to say these numbers are useless or that if I had used this search volume, my listings would have failed due to being so far off. It’s not THAT bad, despite such a poor accuracy rate. However, in Jungle Scout blogs for years they keep printing strange studies that mention differences in accuracy of 5% here or 11% there, etc…..so I’m just going to try to use the same standards for this study. Let’s now compare Helium 10 search volume for the same EXACT time frame.
Remember that Helium 10 is based on normalized search volume. The only thing we can compare it to from Amazon would be Brand Analytics. Since there is no search volume in Brand Analytics, let’s just do the same comparison we did above, and compare the relative order of the keywords, sorted by searches, so that we are doing the same comp as Jungle Scout had above. Here are the results.
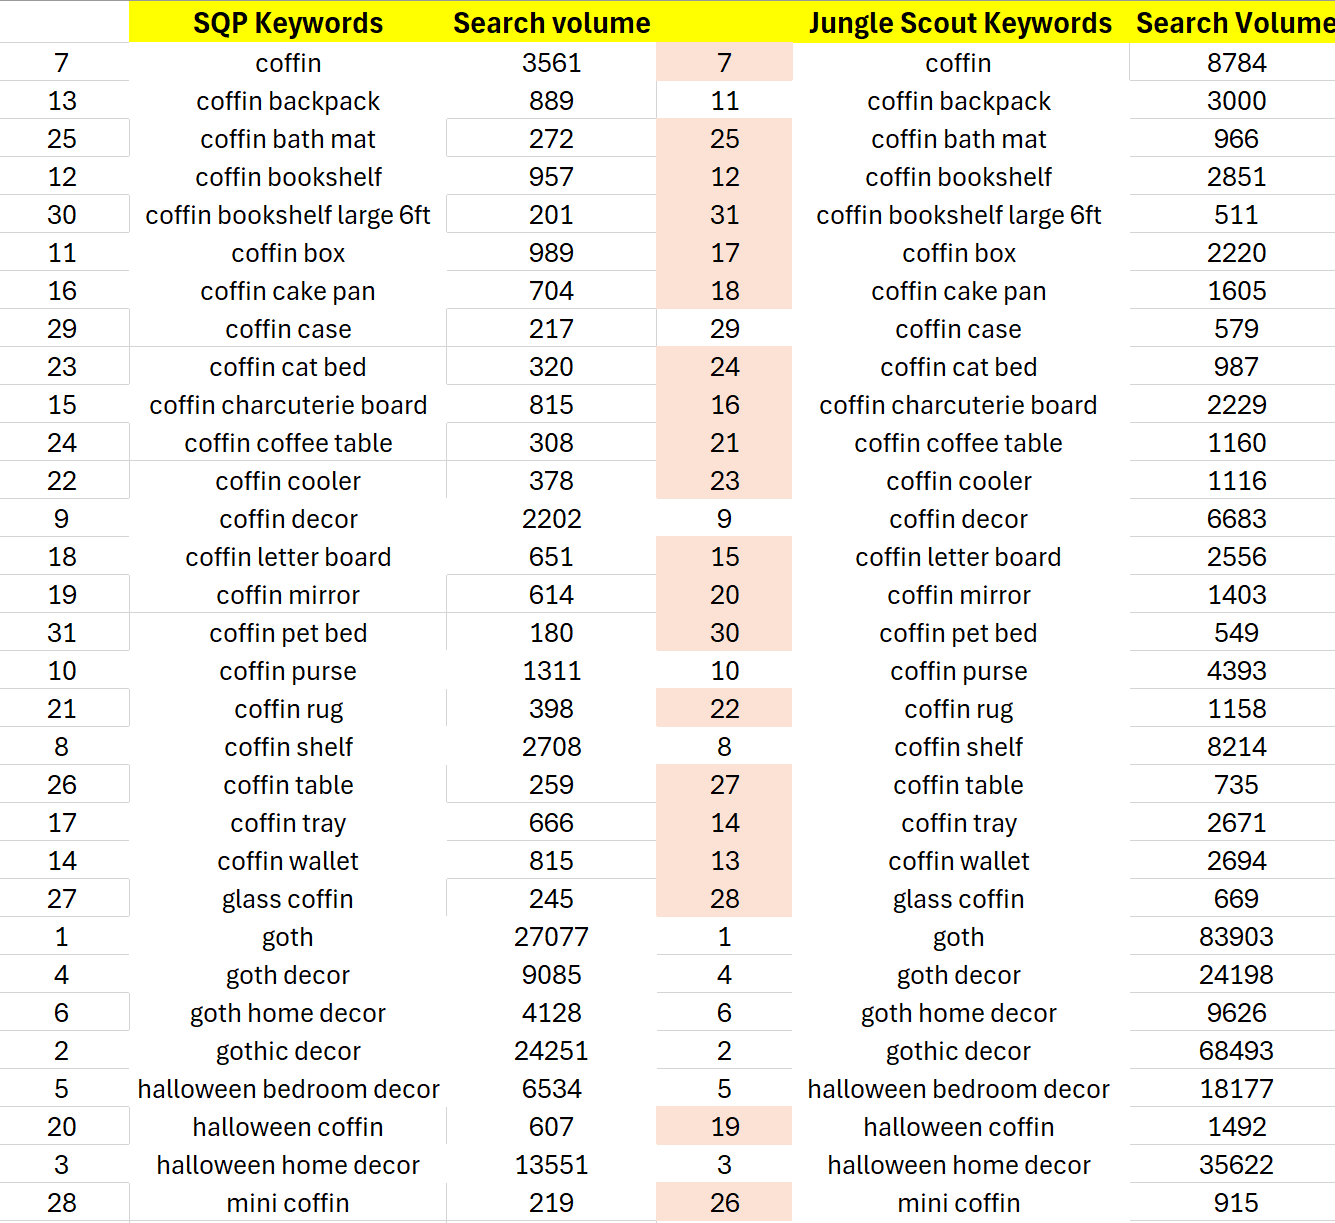
Helium 10 vs. Brand Analytics
On the left you can see the Brand Analytics Keywords in the order of searches, and on the right, Helium 10 with the same keywords sorted in its orders. BOOM GOES THE DYNAMITE! As you can see, Helium 10 has the EXACT SAME order for all keywords on this list other than 2 at the very end! 93.5% accuracy!
I could have just dropped my mic right there and called it a day. However, as I started looking at things, something was bothering me about the Jungle Scout numbers that made me question if I was giving them a 100% accurate evaluation of the comparison. So I dug a little further.
For example, I noticed that Jungle Scout had a detail page that showed week-by-week search volume. I thought that was pretty cool. However, when I added up the week-by-week numbers, I noticed that it did not add up to the monthly search volume. So now I was second-guessing myself…..could it be that I was basing my comparison on the wrong numbers?
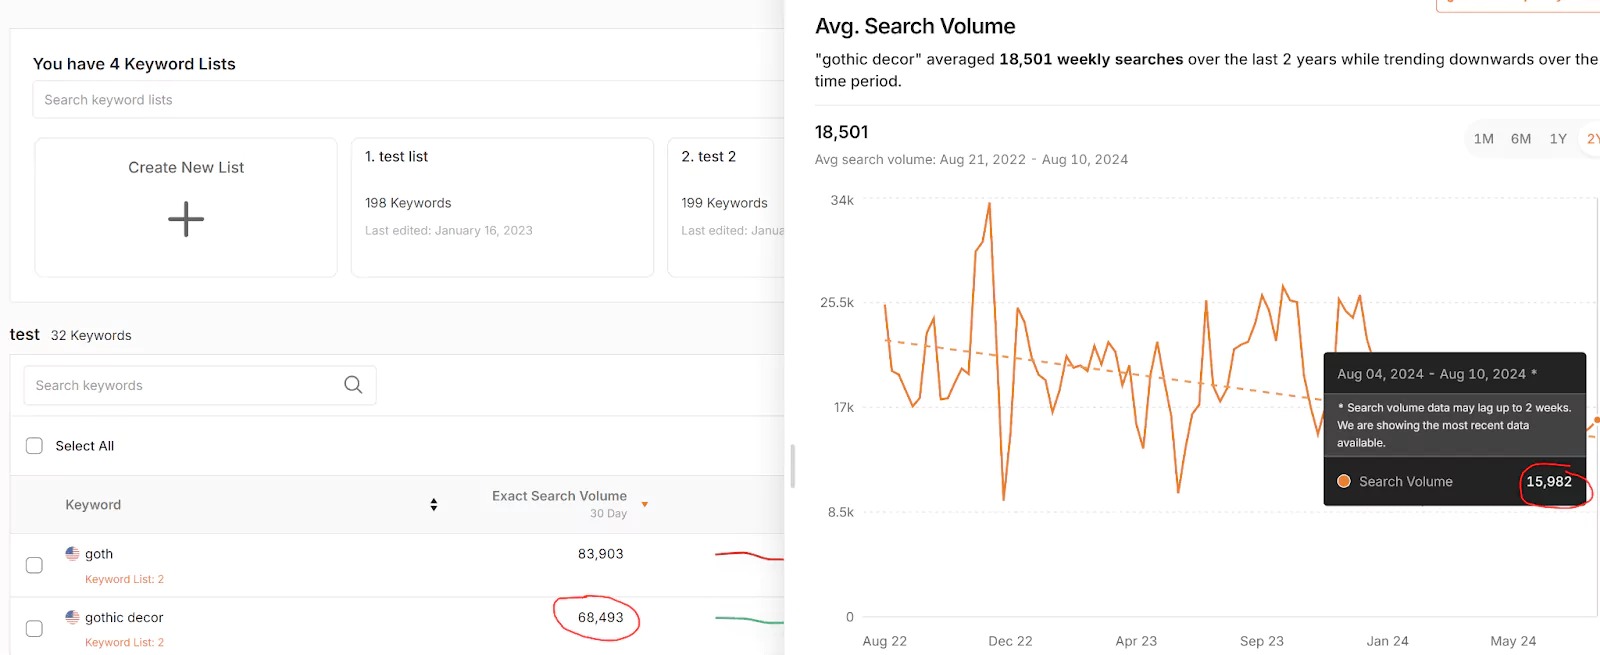
Further Analysis of Jungle Scout’s Data
After a lot of playing with the numbers, I was able to figure out HOW Jungle Scout is coming up with their monthly search volume, which is the main number they use. (you cannot see the weekly anywhere….nor filter for it, etc). What they are doing is actually something very similar to what Helium 10 does. We show our monthly search volume as a “velocity” based on the most recent week’s searches.
Jungle Scout really is taking their last week’s search volume, and then dividing it by 7, and multiplying it by 30 to come up with their monthly number! That’s why it didn’t line up. So, what I decided was that I would give Jungle Scout another shot at a comparison.
Even though if you compare apples to apples, their full month search volume with SQP full month, is way off. I decided to go in and compare JUST the last week’s search volume for all of these keywords, since that is what they are basing their monthly search volume on anyway, to the SQP search volume from the same week. Here are the results.
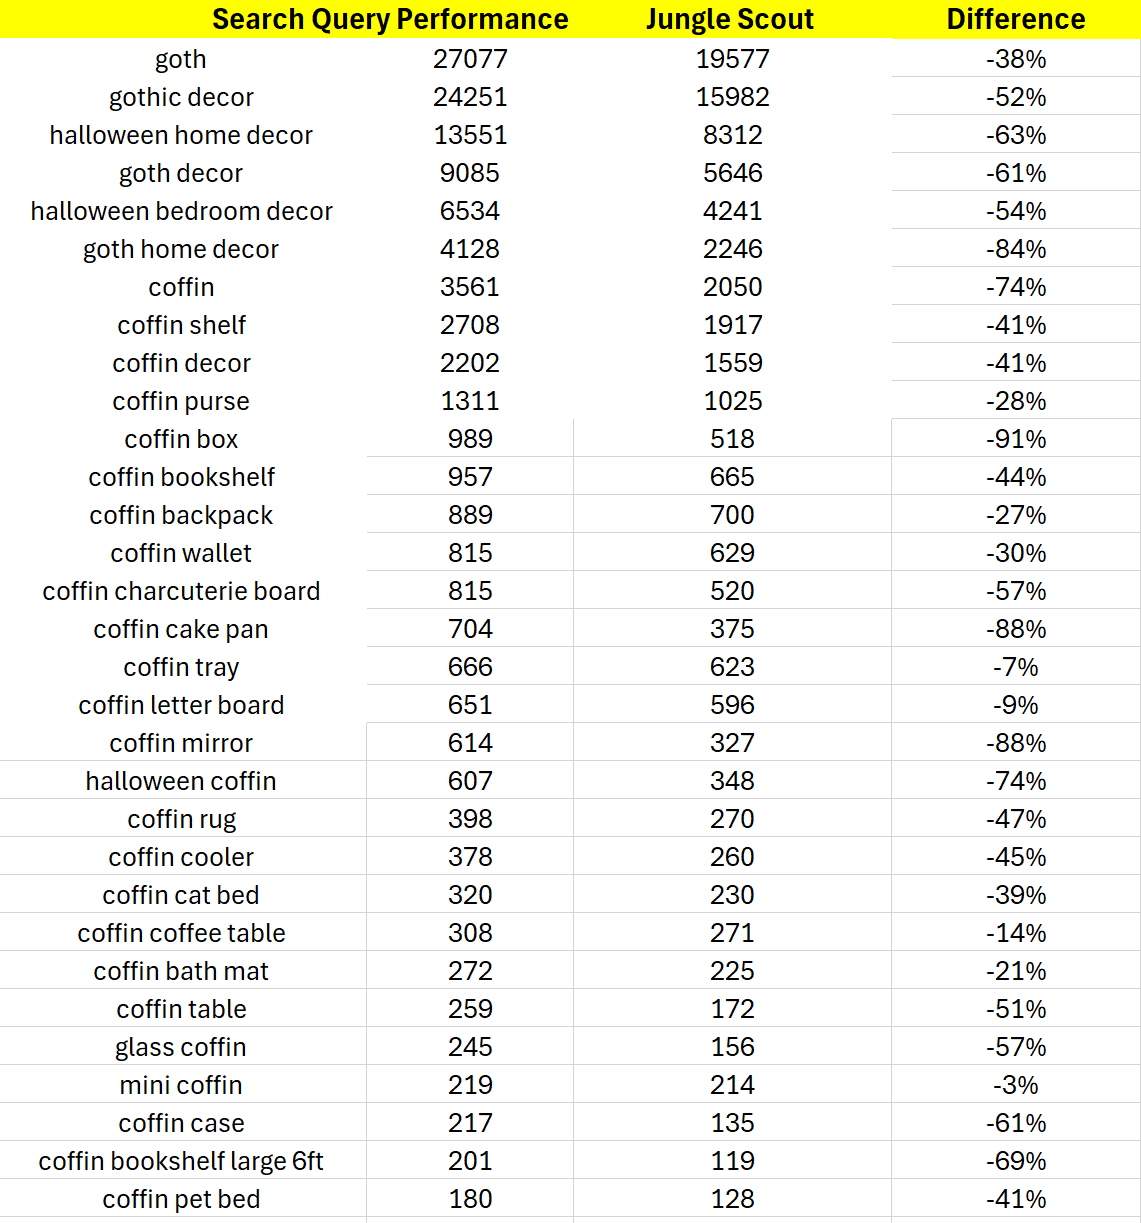
If you look at the raw search volume numbers, that week’s search volume was even more off than the monthly….48% lower on average! I wanted to make sure though that I did EVERY kind of comparison possible to cover all the bases. So again as I did before, I decided to compare the search ORDER instead of just the raw number of this week’s data.
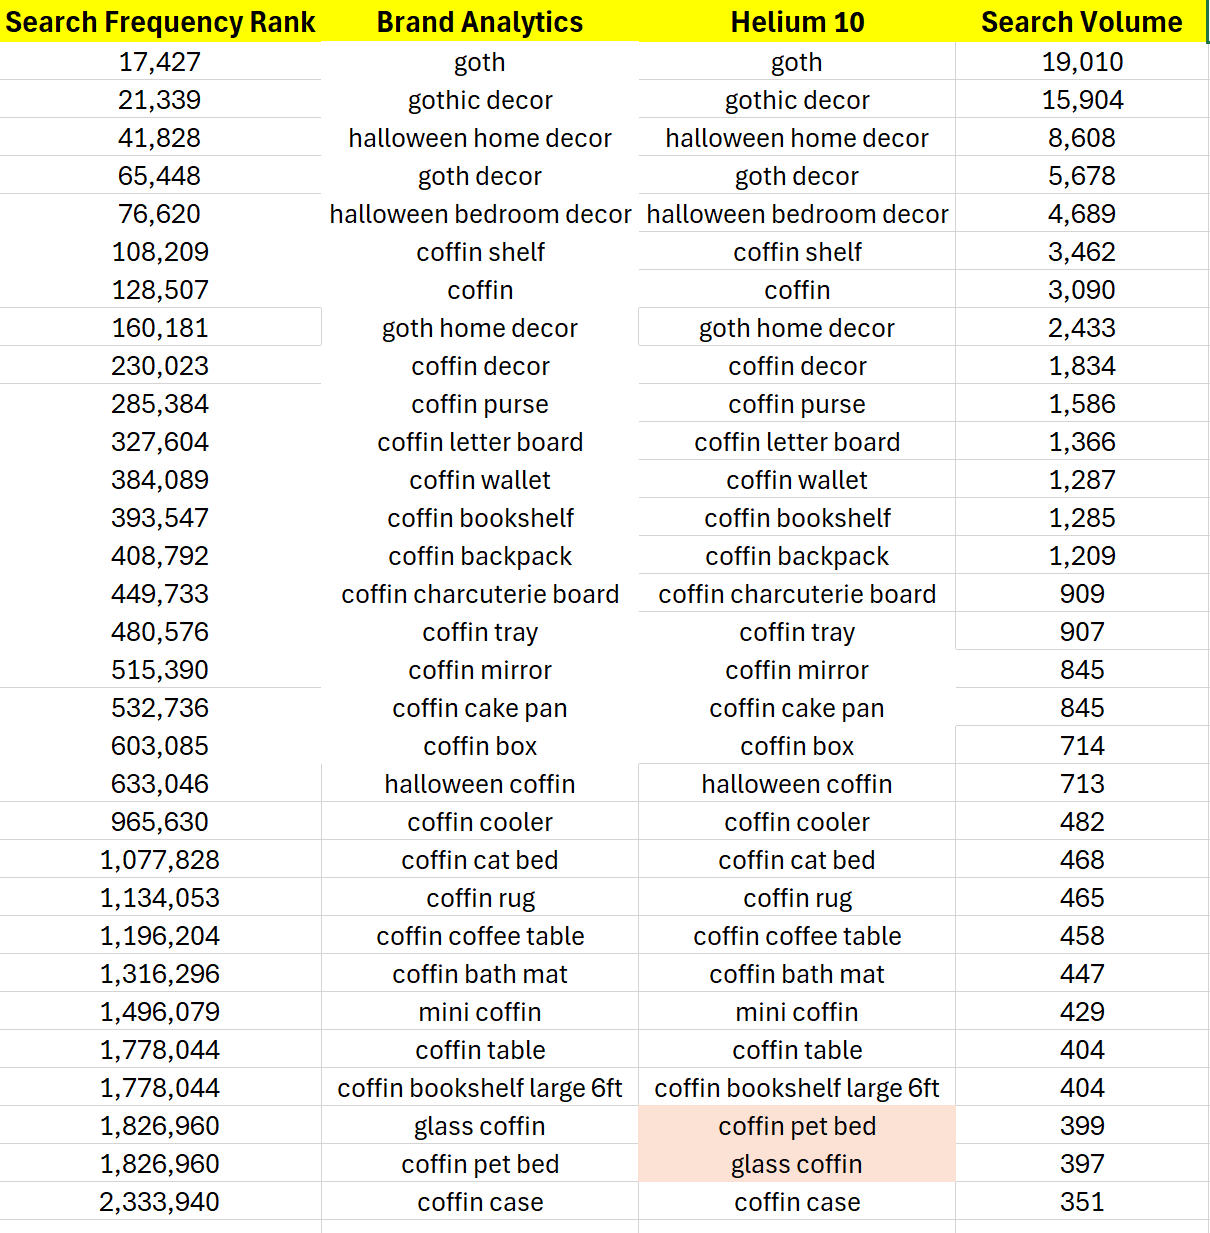
From the shaded ones above you can see how many Jungle Scout had the wrong order on. 11 correct out of 31. 35.4%. The worst number yet. So I decided to go ahead and just give them that first number of 41.9% accuracy.
Interpreting the Results
Let me reiterate. I DO NOT THINK these numbers are terrible or unusable. Would you maybe make a few wrong decisions here and there due to this accuracy? Absolutely. Would you have made the wrong decisions using Helium 10 data in this scenario? No, because we were 93.5% accurate, and only had the mixed-up order on two keywords which were right next to each other anyway. But again, despite this 60% difference in accuracy, you will not find me making outlandish claims like Jungle Scout does over much less.
If you haven’t seen it before, here is how they present differences in accuracy of much smaller percentages.

Now, the first funny thing here is 84% – 74% is NOT 14%! (Can I add a “LOL” to a blog?). Even under their test which I can’t see the data on, the number they decided to go with was 10% off (or 14, if you use their math). Now this was about sales estimates they said. What was their conclusion about this small difference in accuracy?

Our 10% supposed difference that somehow turned into 14%, now all of a sudden turned into a 12% difference there…maybe they wanted to split the difference? Either way, it’s literally meaningless even under their scenario, when it comes to making a decision.
If you are analyzing a niche to get started selling on Amazon and you see one competitor is estimated by Jungle Scout to be selling $8,400 a month, but Helium 10 estimates it to be $7,400 a month, are you going to change your go/no-go decision on getting into that niche based on the difference? Of course not. Yet they paint it to be this huge deal.
The search volume order we went over, Helium 10 has SIXTY percent more accurate order of keywords compared to Jungle Scout. SIXTY! But I am not going to sit here and try to say that this is the end of the world. It’s not. Where Helium 10 crushes Jungle Scout is not the search volume, despite this accuracy difference.
Conclusion
Where we excel is in our overall accuracy, the number of tools we have, the number of core functions that we have that they don’t, and the level of data that our users have access to that Jungle Scout users don’t. There is a reason why we have over 1 million active users in the Google Chrome Store, and they have less than half. Most Amazon sellers know that if they want the most accurate data points, the most actionable insights, and to have a chance to make the most money on Amazon, they choose Helium 10. They don’t choose us just for our 93.5% search volume accuracy rate!
Achieve More Results in Less Time
Accelerate the Growth of Your Business, Brand or Agency
Maximize your results and drive success faster with Helium 10’s full suite of Amazon and Walmart solutions.

