Find Out if Your Product Has the Top Conversion Share and Click Share


Helium 10 tools give access to a wealth of data that Amazon sellers can use to improve their marketing strategies on Amazon. One of the most important metrics Amazon sellers should pay attention to is the click and conversion share of their keywords. By tracking these metrics, businesses can identify the top-performing products for a particular keyword and adjust their marketing campaigns and listing optimization strategy accordingly.
In this Cerebro keyword strategy, we’ll be exploring the history of the Click Share and Conversion Share of a particular keyword using Brand Analytics data from Helium 10. Specifically, we’ll be looking at the keyword “coffin shelf” and examining the top-clicked products for this keyword on a weekly basis for a selected date range of January 2022 to December 2022.
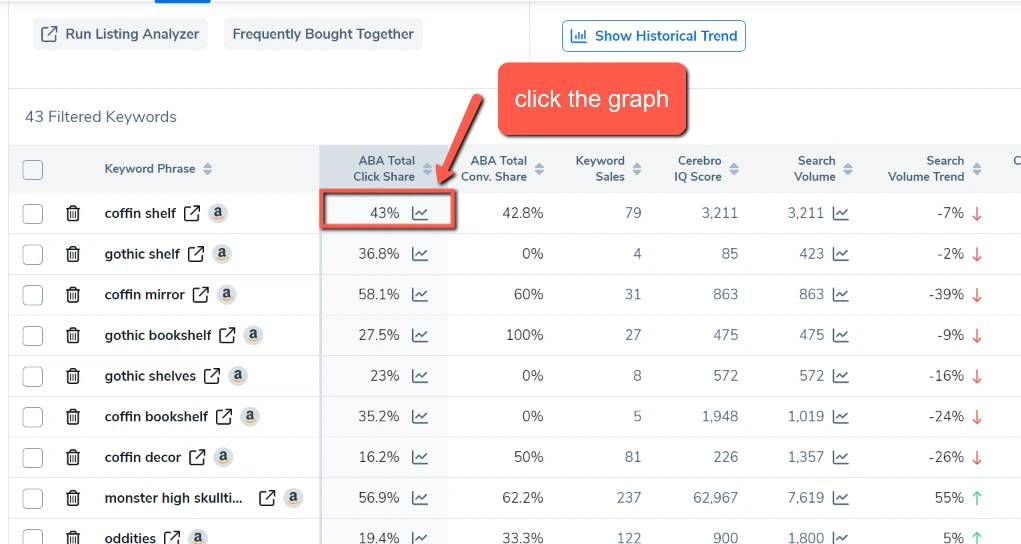
To get started, you need to first do a reverse ASIN search in Cerebro with your ASIN or a combination of your ASIN and a list of competitor ASINS. In the search results, you will see click share and conversion share as the first two columns after the keyword results. If this space is empty, that means you have not connected your Helium 10 account to Amazon and/or you don’t have Brand Registry which would mean you could not get access to Brand Analytics data.
Once you see the keyword that you want to see the click share and conversion share for, click on the tiny graph icon to expand the section and see more.

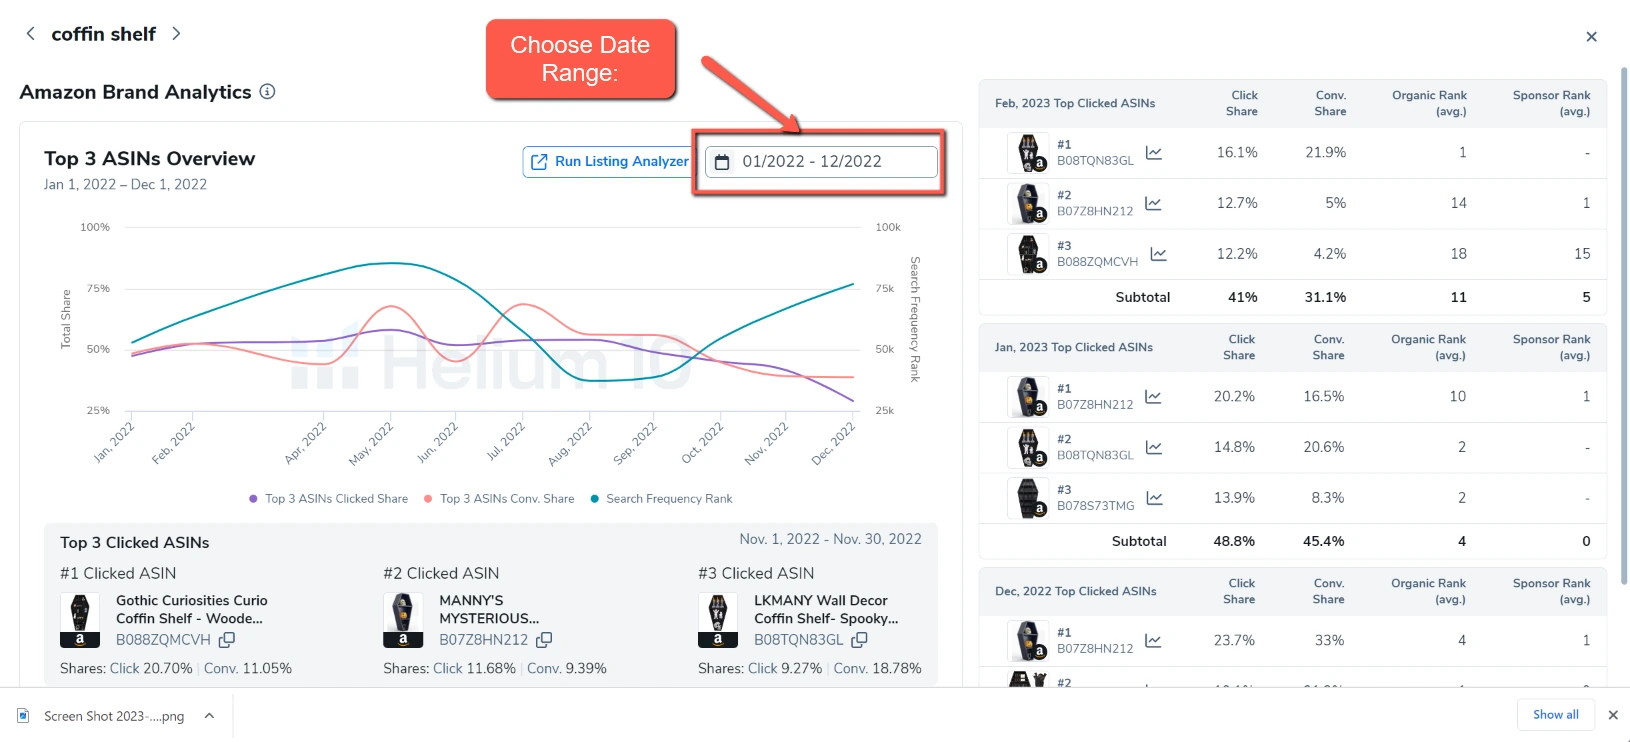
Once you have clicked on the graph, it should look like the image below. Then, you can select a date range. You can choose weekly, monthly, or quarterly and you can also choose a custom range. We chose a custom range of January 2022 to December 2022 for this example.

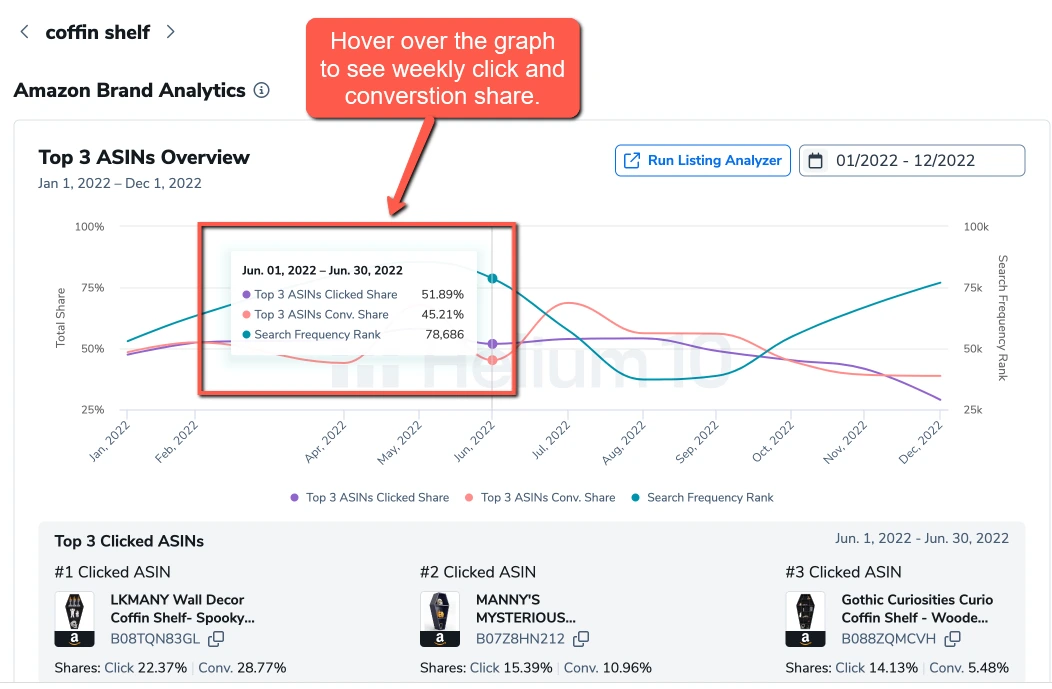
Once we’ve selected the appropriate time frame, we can see a week-by-week breakdown of the top-clicked products for this keyword. This is an incredibly useful tool for Amazon sellers, as it allows them to identify which products are performing well and which ones may need some improvement. For example, we can see that the Helium 10 coffin shelf is one of the top-performing products for this keyword, showing up more often than not in the top three clicks.

But it’s not just about the number of clicks – Conversion Share is an equally important metric to consider. Conversion Share tells us how many of the purchases made after a search for “coffin shelf” were for our product. In other words, of all the purchases made after this keyword search, how much of a share did our product have?
Looking at the data, we can see that for one particular week, the Helium 10 coffin shelf had only 14 conversions, despite having a relatively high number of clicks. This is an important reminder that Amazon should not solely focus on the number of clicks – it’s the conversion rate that ultimately matters. Seeing that the conversion rate is down should indicate that the listing needs to be better optimized for conversion and sellers can make adjustments to increase conversions such as creating better images and listing copy.
In conclusion, the history of the Click Share and Conversion Share of a keyword is an incredibly valuable tool for Amazon sellers looking to improve their click and conversion share. By tracking these metrics, sellers can identify which products are performing well and which ones may need some improvement. Additionally, by paying attention to Conversion Share, sellers can ensure that they are maximizing their conversion rates and getting the most out of their optimization and marketing efforts.
Achieve More Results in Less Time
Accelerate the Growth of Your Business, Brand or Agency
Maximize your results and drive success faster with Helium 10’s full suite of Amazon and Walmart solutions.

