Can 3D Rendered Product Images Boost Your Conversion Rate On Amazon? (We Put It To The Test!)


Table of Contents
- Case Study Results
- How Did We Run The Audience Poll And What Criterion Did We Use?
- Now For The Fun Part!
If you missed Part 1, catch up here. We covered all the basics regarding 3D product renders, where to start, and which products are best suited for the “3D treatment.”
Now it’s time to put what we know to the test!
Case Study Results
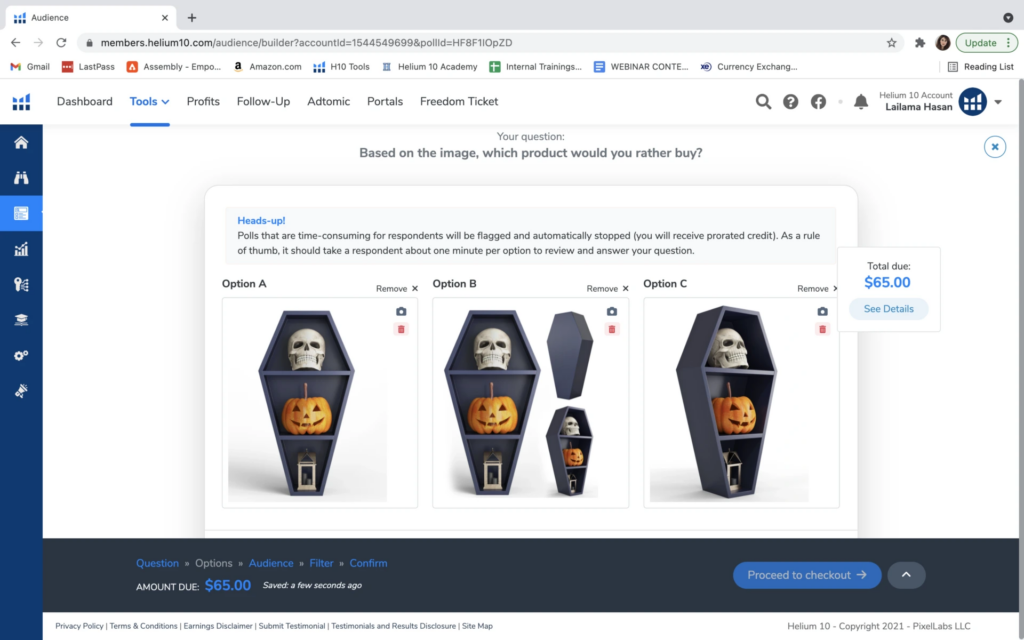
First, we ran an Audience poll (using the Helium 10 split-testing tool, Audience) on the three variations of the the main image that Fade Visuals created for us. Our results displayed a clear winner among the three; Option B came out winning with a score of 76, compared to 12 for the other two options.
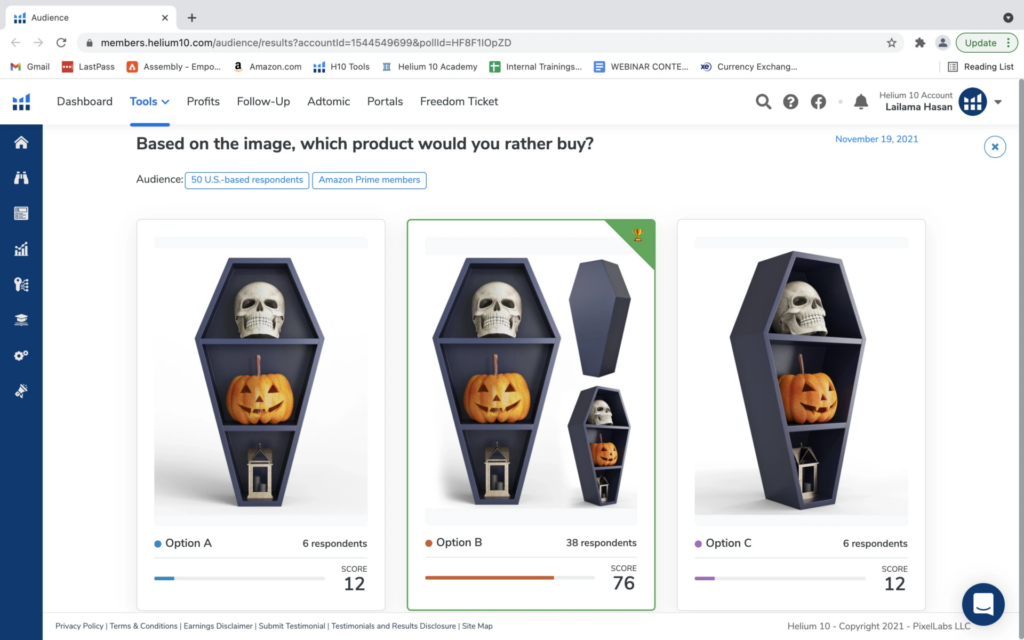
Here is a snapshot of what the voters had to say about the different options and why they preferred one over the other.
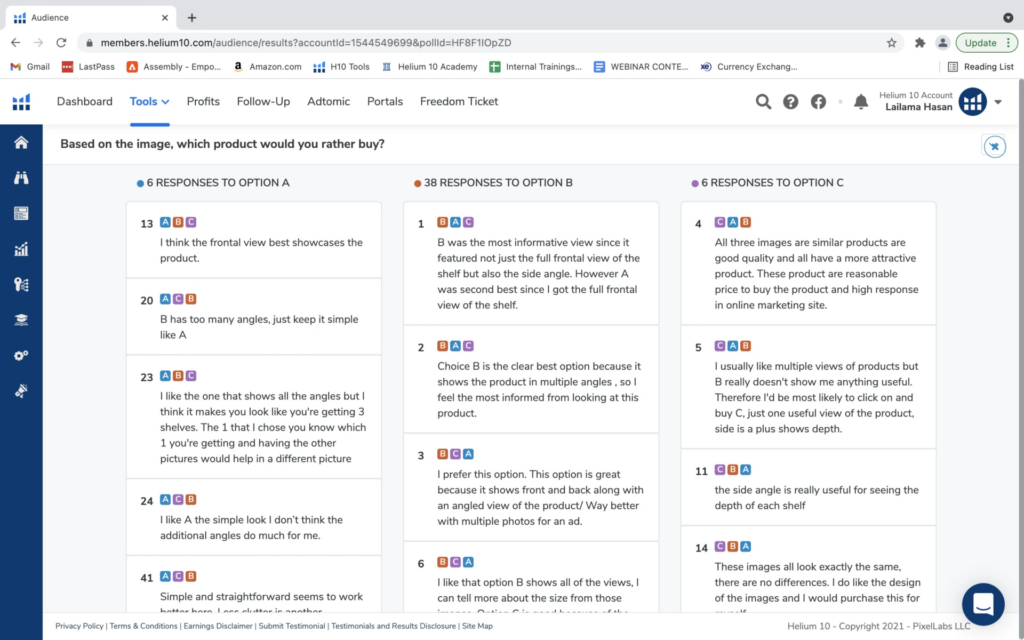
First, we wanted to see if having this new main image would increase our page views. We were hoping that the better-looking image may result in more visits to our listing.
Before the image change, our average page views per day was 53. After the image change, the average page views went up to 62, representing a 17% increase!
The next thing we wanted to do was see if we could increase our conversion rate with more attractive secondary images, so we changed the rest of the images as well.
Before we made the change, the Unit Session Percentage was 15.17%. After changing the images, the Unit Session Percentage went up to 18.26%.
Now, you might be thinking… is 3% even worth anything? Let’s do the math. Let’s say you only averaged 100 sessions a day. That means in 6 months, you would have 18,250 sessions. 15.17% conversion rate would result in 2,768 units of sales. If your product retails for $30, that would be about $83,000 in revenue.
But, what if your conversion rate was 18.26%? You’d now get 3,332 units of sales representing $100,000 dollars worth of sales! Just a few percentage points can represent large amounts of money over time.
How Did We Run The Audience Poll And What Criterion Did We Use?
The first step would be to go to www.helium10.com, sign in to your account to get access to our Audience tool, and click “Create Poll”.
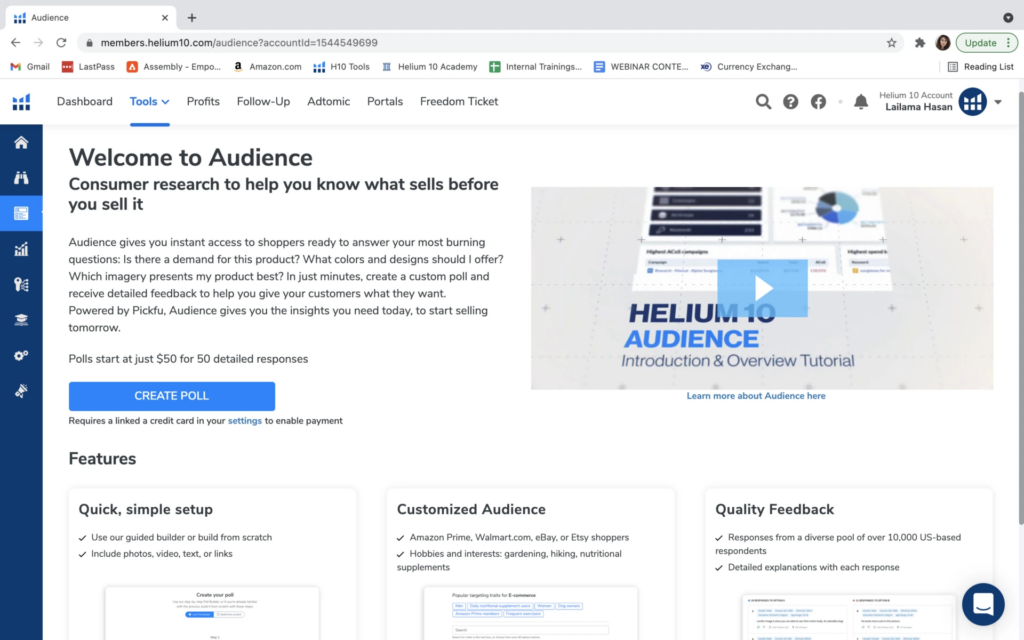
Next, I used the poll builder so that I don’t have to worry about creating my own poll from scratch. This is especially helpful if it’s your first time using this tool and you are unsure of what a poll should look like!
It’s a great way to learn in order to customize your polls in the future.
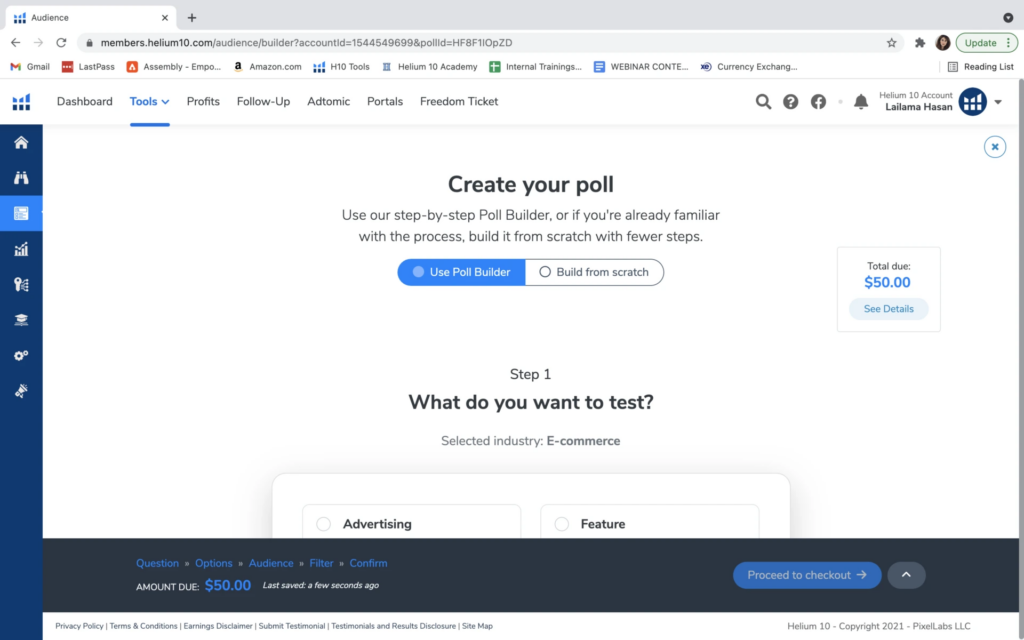
Now I want to know, which of the three variations of main images that Fade Visuals created for us, would my audience like the most, and would ultimately give me the most impressions on my listing? So I choose the main image option here as shown below.
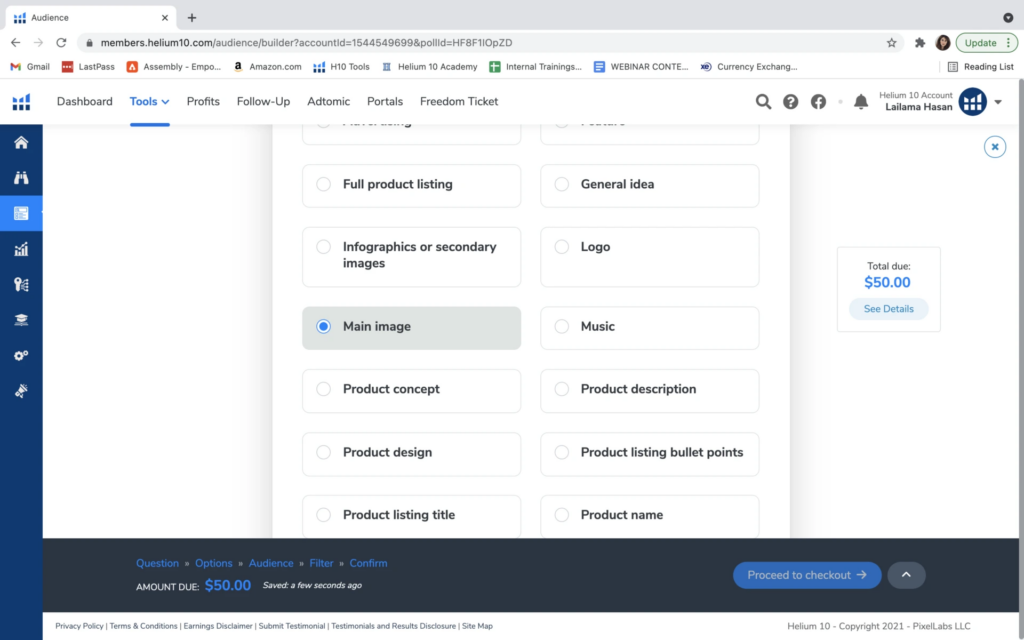
As you can see, Audience generated pre-made questions in the poll. I will choose the one that is most relevant to our test: “Based on the image, which product would you rather buy?” Meaning, if the same product was being sold by three different sellers and each seller had one picture each, which seller would get the most sales?
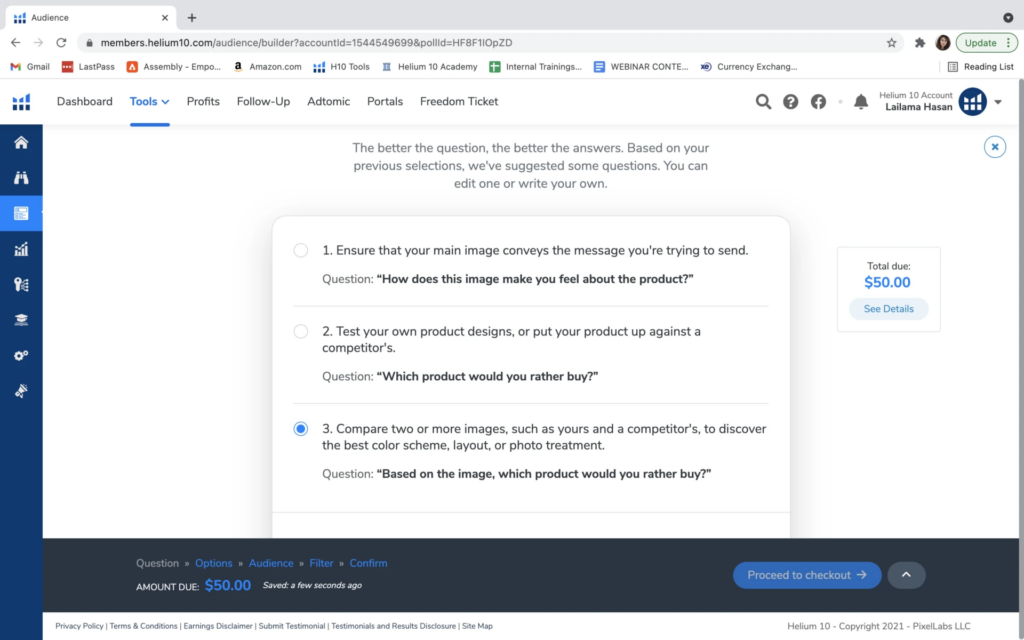
After everything is uploaded, Audience will give me the total price for the transaction and I will then hit “Proceed to checkout”.
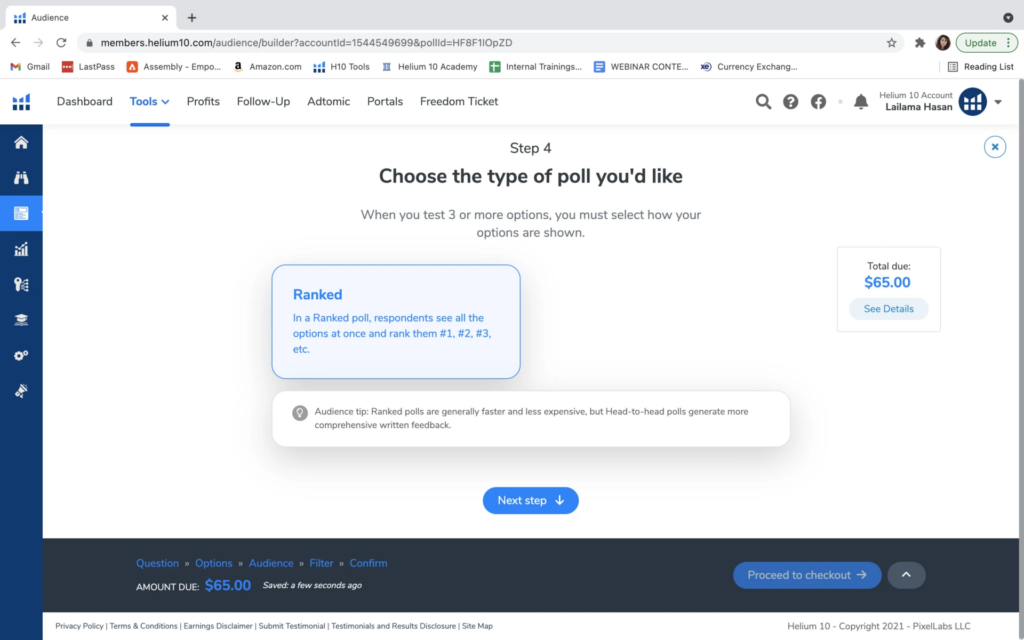
I was only given the option of “Ranked” so I will click on that option and click “next step” to move on.
Now For The Fun Part!
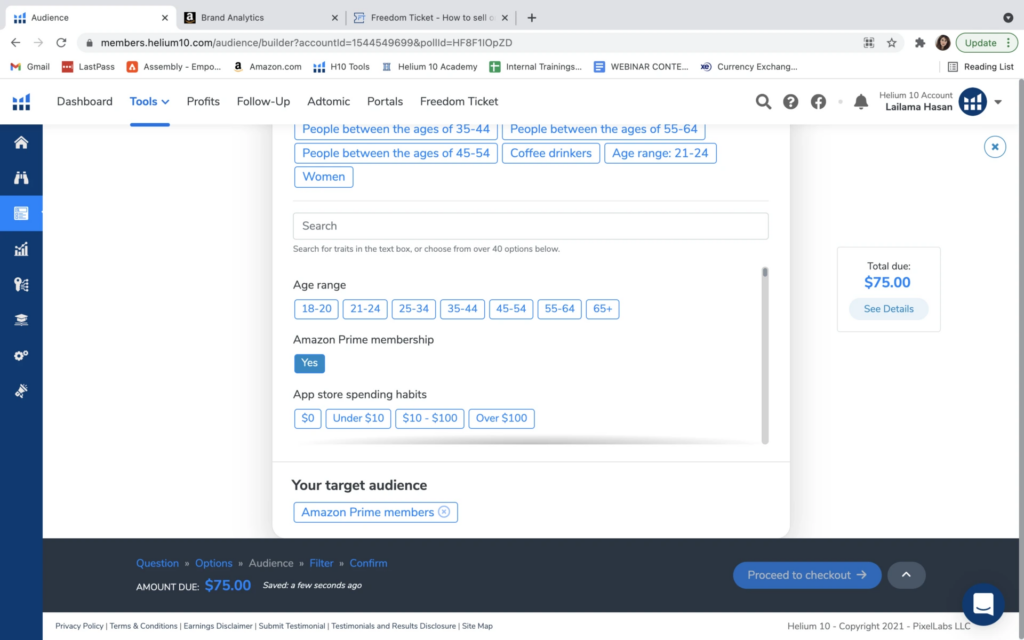
This step allows you to choose different traits to filter out your demographic and give you focused results. This is a great option if you are running multiple polls and have a good data set on your demographic.
One way of getting data on your demographic to run such polls would be to use the Brand Analytics tool in Seller Central. This tool will be available to you if you are brand registered. This is great for products that are, for instance, unisex. You may want to know which images appeal more to your female and male audiences and want to include one image to target each demographic.
For this poll, I chose Prime members as my filter.
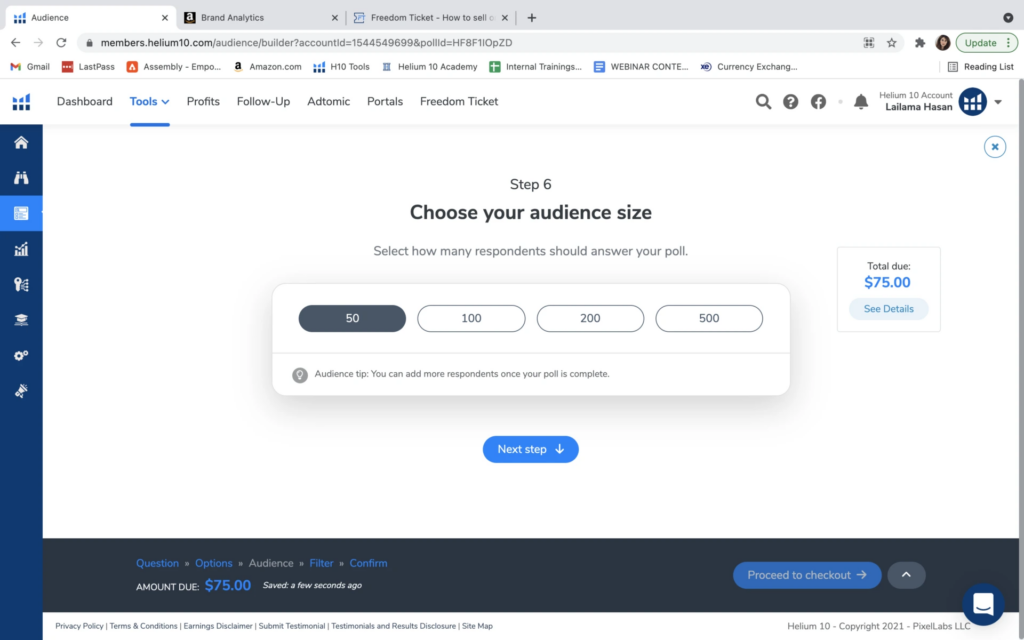
The next step is to choose an audience size. For our example, I went with 50, however you can choose any number you wish. Remember – the bigger the sample size the more informative the data, is so feel free to choose a higher number.
The next step is to choose different traits. Because my poll was not as complex, I went for the free traits that Audience has made available to me. For those of you who are running more complex and focused polls, you may want to select from the 40+ traits, habits, and usage options available to you.
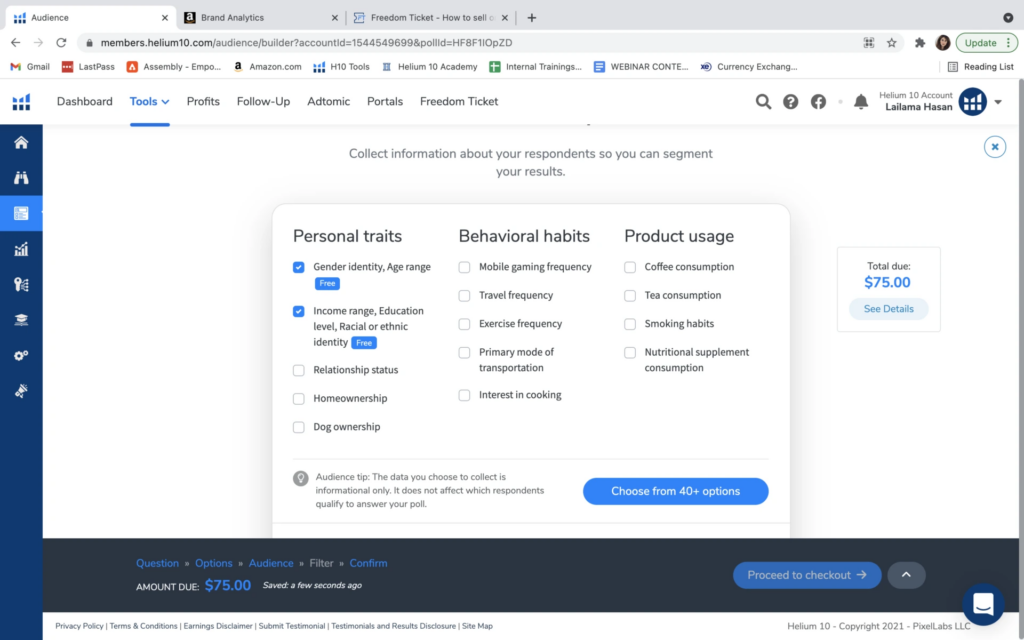
This brings us to our very last step, which is confirming that all data points have been input correctly.
Now we can complete the transaction!
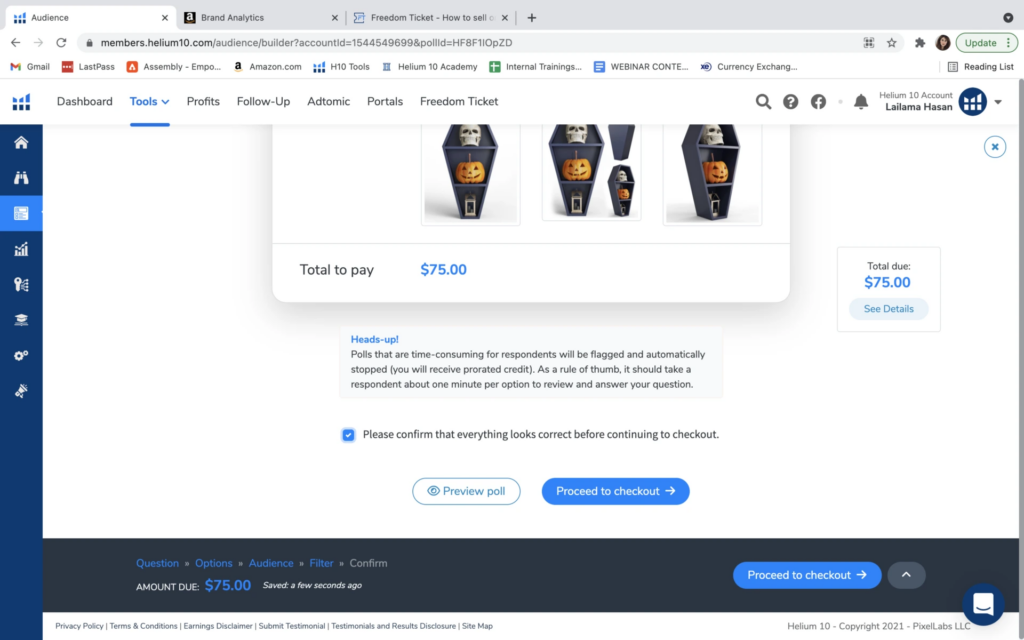
You will have to wait for about 2 to 4 hours to get the results back. Check your results and make the appropriate changes to your listing!
We had a great time experimenting with 3D rendered images for our listing. Since Project X aired on YouTube, we have had the same main and secondary images, so it was past time to give our listing a refresh. It’s really quite amazing how realistic 3D images are, and how, in this case, they resulted in an increase in our page views and conversion rate. There is absolutely nothing wrong with traditional product photography. But for your next or existing product, you now have another option to think about for your listing images!
Thanks again to Anthony for the help on this project, along with Fade Visuals!
Achieve More Results in Less Time
Accelerate the Growth of Your Business, Brand or Agency
Maximize your results and drive success faster with Helium 10’s full suite of Amazon and Walmart solutions.
